
Table of Contents
Abstract
This tutorial is meant as an introduction to programming 3D computer graphics. You will learn how to program a 3D rasterizer (one of many different approaches to implementing 3D computer graphics): this isn't about programming a game or using the latest HTML5 features. It is, however, meant as a way to introduce you to how 3D computer graphics work "under the hood". Essentially this tutorial walks you through what OpenGL and DirectX have implemented in their respective code-base (and drivers), without system or library specific overhead.
Introduction
About & Goals
Welcome - you are about to embark on a fascinating journey through the world of 3D computer graphics for programmers! What are 3D graphics and why should I, as a programmer, care? 3D graphics are graphics in the third dimension / space, usually rendered onto a 2D (flat) surface. This is essentially the process of taking a 3D world from a video game and displaying it to a user's screen. Sounds trivial? It isn't, but don't be deterred - having the knowledge of how this is done will make you a top-notch computer graphics programmer. 3D computer graphics have many applications well outside of video games: medical imagery, robotics research, data visualization, etc.
A preview of what's to come: though many lessons will render only simple geometry, everything learned can easily be applied to complex scenes and geometry.
"What's this about OpenGL, DirectX, and game engines I keep hearing about?" Great question! Those are actually two separate categories: computer graphic libraries take given geometry, images, lighting information, etc. and generate a 2D image output. What we are covering in this article is how the internals of those libraries work: how exactly does a computer calculate where and how to draw a cube, or other arbitrary graphics data? The second category would be game engines, which are generally a set of other libraries (user input, audio, texture loading, etc.) making your rendering engine more interactive to the user.
This tutorial will walk you through how 3D rendering works at its core: we purposely avoid using any existing code or libraries to keep all rendering steps visible to you. You should be warned at this point that this tutorial, unlike what you will commonly find on the web, is not to teach you how to use 3D engines or libraries. Instead, if you want to write your own rendering system and understand how OpenGL and DirectX work internally, this tutorial is perfect for you!
Before going into the actual tutorial, there are a few things you should ask yourself and understand. A big question is why use 3D in the first place? Simple: When you draw an image of a car on paper, it’s only an image of one view facing the car. If you draw a 3D model of a car, you can move and rotate your view in any number of ways and render an almost infinite number of images from it. Instead of having an artist make one texture (the car image), they can instead make a 3D model that can be presented to the user from any position and angle possible. There are also a dozen other benefits, such as making animated films more realistic, adding depth to gameplay mechanisms, make interactive media much more life-like, and more.
In this tutorial, we will be creating a software 3D renderer in JavaScript using the HTML5 Canvas tag. What this means is that we will be creating a 3D rendering system, written in JavaScript, that does not use any hardware acceleration (i.e. the use of any hardware features outside of standard JavaScript), and the output is placed into the HTML5 Canvas tag (a dynamic 2D rendering surface). This software renderer will be a "fixed-pipeline", where we do not dynamically redefine how projection transformation and per-pixel operators work at run-time. The feature that allows us to do this is called Shaders, and is well beyond the scope of this article, though an important topic to know when using hardware-accelerated graphics libraries.
This tutorial will not use WebGL, the modern standard for browser-based 3D graphics, because the goal here is to teach how 3D rasterization works, not how to use an existing library. JavaScript was chosen since most users have a web browser capable of quickly executing JavaScript. JavaScript also lowers the entry-barrier to this tutorial, since it isn't system-specific and does not require special software that doesn't already exist on almost every computer. Note that this tutorial will still require a modern browser, such as Chrome, FireFox, Opera, IE 9+, etc. because of the need to support the HTML5 Canvas tag.
You should know the basics of JavaScript (ECMAScript) or some sort of C-like programming languages (C++, C#, Java, Objective-C, PHP, etc... since this article takes an imperative programming language approach to JavaScript). If you need help getting started with JavaScript, check out Mozilla's great JavaScript guide or the lighter Mozilla Re-Introduction to JavaScript. W3School's tutorials are also great casual introductions to JavaScript. Also, it is highly recommended that you are comfortable with the basics of trigonometry. Knowledge of linear algebra (matrix manipulation) will be even more helpful.
Computer Graphics
Computer graphics is the process of rendering graphics through computers. It's as simple as that, but the field includes many interesting topics and subjects well outside of just "video game graphics". Texture synthesis (creating a new texture from scratch), world generation (creating a world through algorithms), face detection (finding people's faces in a photo) are all within the domain of computer graphics.
Computer graphics can be basically put (this is a big trivialization) into two categories: real-time and realistic computer graphics. Real-time simply means that the application can be manipulated and changed without any sort of latency or slow response, hence the term "real-time". The advantage is that your scenes are rendered fast as well as can be interactive, though the tradeoff is that you lose realism because of optimizations. Classic examples of this are most 3D rasterized video games; Doom, Quake, etc. On the other hand, realistic computer graphics are very detailed and can be life-like, internally simulating the way optics work down to per-pixel levels. Rendering these scenes take many hours of intensive computation, but produce very clean and sharp images. Another way of remember the difference is that real-time graphics tends to work by drawing polygons (generally triangles) on-screen, which can be done very quickly. Realistic graphics goes a step beyond that, drawing the scene through pixel-per-pixel filling.
It is important to note that there are many different approaches to real-time 3D computer graphics, with each method having their respective strengths and weaknesses. Scanline rendering does a top-to-bottom image row check for possible collisions amongst scene objects. Though good for accurate depth-detection, the algorithm is slow because it requires iterating through all scene models (though there are ways of speeding this up). A similar method, called Ray-casting, used in Wolfenstein 3-D, renders scenes in a similar way, but has a subtle trick for fast run-time performance: instead of checking per-pixel, the camera only checks pixels along the image's middle horizon: if a collision is observed on a point on that horizon, then the vertical scale of walls are changed in respect to that distance. In essence, it's a way to very quickly draw uniform walls, but it fails at dealing with complex geometry. Voxels, recently made famous by Minecraft (though interestingly, Minecraft's output is through a polygon rasterizer using OpenGL), are fast for data reading and writing, but give a block appearance. There are tricks to change the output to a more smooth-like surface, but that tends to be computationally intensive because of the cubic growth of data based on scene size. This list is by no means complete, but gives a general overview of common methods, with the one we are talking about to be described below:
Polygon rasterization is the most common approach for real-time computer graphics. Though not remarkably modern, it has one subtle advantage that has made it the king of real-time graphics: it can be massively parallelized. Rasterization is the process of taking a simple geometric primitive (the most simple being a triangle, more on that later), and map it from 3D space to 2D space. This also includes scaling, rotation, and other changes on the points, but the idea is that for each point that makes up a triangle, where a group of triangles form a mesh, all points are stateless: drawing one point doesn't affect how the other is drawn. Thus, we can compute this data in parallel, and that is exactly what graphics cards do: the reason why we have hardware acceleration is that CPUs are great at doing one thing at a time per core, yet graphics cards, though "slower" in terms of single-operation computational speed, have massively higher throughout because they can compute hundreds of thousands of points in parallel.
An example, from the rasterization-based Irrlicht engine, on the left, and an example ray-tracer with depth-of-field enabled, on the right.
Our approach will be to program a rasterizer, taking triangles (forming arbitrary models) in 3D world-space, and mapping them out to 2D screen-space. This is called a "software renderer" because we aren't using hardware acceleration that is provided by OpenGL and DirectX. Instead, we are going to implement all of these low-level steps in our own code as an academic exercise, and have it be executed one step at a time like what a single-threaded processor does.
You may be wondering why we use dedicated hardware to just raster triangles, but not implement ray-tracing, since I've mentioned this special hardware is all about mass-parallelization? Ray-tracing is much more complex than casting a single ray for each pixel: ray collisions need to look around for light sources, compute the reflection and refraction of materials, and detect shadows. Simply, ray-tracing is far too computationally intensive, while rasterization is still considered a good balance between computational complexity and visual results. What is interesting is that every day we are getting closer to producing cheap hardware that is powerful enough to do ray-casting in real-time. We are close to cheap real-time ray-tracing methods and hardware.
Regardless of the method chosen to render a scene, the output is generally a single 2D image. Our human eyes are very interesting in that if a set of images are iterated through to us, at fast enough speeds, we cannot distinguish between individual images. This turns out to be a good thing, as our brains stop interpreting those individual images and starts interpreting them as small changes, as an "animation": this is where the term movie ("moving images") comes from. In computer graphics, to produce animations in real-time, we render individual images and show them very quickly to the user, usually between 24 to 60 frames a second depending on several desired output properties. The higher the frame rate, the smoother the animations look, but the more work has to be done for the computer. 24 frames a second are considered a general "minimum speed" that will appear "smooth enough" to the average observer to look like a video. This article will focus on real-time animations: we will render to a single image, present that image, then render the next image. We will design our code to do this 60 times a second, thus have a 60 FPS target, and create a true real-time 3D rasterizer.
Development Tools & Conventions
Before getting into the actual code itself, we have to choose what language to program in, and how to draw the basics. For the sake of simplicity, we will choose JavaScript and the HTML 5 Canvas element. JavaScript is commonly used for developing interactive websites, but it is also a powerful scripting language. Though it is not known for its speed, it does have other benefits such as dynamic typing and a C-like syntax. Canvas, the HTML element we will render onto, is perfect for this tutorial: most browsers support it, and it doesn’t require any complex resource management unlike creating a native Windows or Linux graphical application. Another reason why we are choosing to use this Canvas and JavaScript combination is that it doesn’t require anything for you to install. This project should be ready to work on without any overhead!
Setting up your development environment is easy since you probably already have everything you need. To program along with this tutorial, you just need a web-browser and a text editor. All you need to do, from this point on, is open up a text editor and start writing down your source code as we walk through this tutorial, save the file as some sort of web page (usually ends with *.html or *.htm) and open it with your browser of choice. It might be more convenient, especially if you need to debug code, to install a true JavaScript IDE (Integrated Development Environment). I'm leaving it up to you to decide what is best for your needs.
Our goal is to keep this tutorial as simple and easy to understand as possible. Because of this, much of the code I will be writing will not be optimal, so that it is easy to read for even novice programmers. I will also write as many comments in the code as possible to make every step that isn't intuitive more clear.
Our coding style will be block-based and use camel notation, where local variables are capitalized, members variables are also capitalized, and globals are all caps. This is simply our style, and does not reflect any sort of design choice other than to try and keep things as simple as possible. I do include more boilerplate code than usual, but this is to keep the code as reasonably understandable as possible.
Throughout this document, there will be many links and comments to other articles on the web. To separate these notes from the main article, I've implemented a "notes" box, which looks like the following:
Note
This is a note!
Keep an eye on these, and make sure to read them while going through the article, but don't worry about completely understand the content as they are merely notes and not critical to understanding the main material.
Throughout the article, there will be checkpoints where you can download the source as a whole. Those points are marked with a download icon & link:
checkpoint
Naturally, this article will have to make many references to equations, but representing them in HTML is challenging since there are no helpful tools outside of generating images (which in some cases, is required). Instead, I've written most equations as cleanly as possible in mono-space font with an explanation of the equation as a whole and what each variable stands for.
(a + b)^2 = a^2 + 2ab + b^2
A simple power-of-two expansion over a the sum of variables "a" and "b".
Any inline source code will be marked-up visually using the SHJS (Syntax Highlighting in JavaScript) tool, as seen below:
// This function returns n multiplied by 2, and then returns the result added by one
function ExampleCode(n)
{
    n *= 2;
    return n + 1;
}
Finally, all internal and external links include a link icon that looks like this: http://www.cores2.com. This is to help you find resources here and external references outside the scope of this document.
Development Platform
HTML Rendering Page
To begin with, we need a simple HTML page that contains an HTML5 Canvas element and a text field to update the FPS (frames per second) counter. To start with, create an empty text document, and copy-paste the following:
Download the "index.htm" source code here.
<html> <!-- Standard head source --> <head> <style type="text/css"> body { font-family: Helvetica; } </style> <title>3D Tutorial - Examples</title> <script language="JavaScript" type="application/JavaScript" src="main.js"></script> <script language="JavaScript" type="application/JavaScript" src="source.js"></script> </head> <!-- When the body loads, let us call the main application entry point --> <body onload="Main()"> <!-- Center content --> <div style="text-align: center;"> <!-- Title --> <img src="CoreS2Logo.png" /> <h4>3D Tutorial - Examples</h4> <hr noshade/> <br/> <!-- Canvas Content --> <a href="source.js"> <canvas id="SampleCanvas" width="320" height="240"> Sorry, but it looks like your browser does not support the Canvas tag. </canvas> </a> <br/> <!-- FPS Counter--> Frames per Second: <input type="text" name="FPSTextBox" id="FPSTextBox" readonly="readonly" size=10 value="Calculating..." /> <!-- Footer --> <br/> <br/> <hr noshade/> <div style="font-size: small;"> <a href="www.cores2.com" style="text-decoration: none; color: black;">Core S<sup>2</sup> Software Solutions - ©2012</a> </div> <!-- End of center --> </div> </body> </html>
Save the file as "index.htm", or whatever name you prefer as long as it is an HTML document, then load it in a browser. If you see a "Sorry, but it looks like your browser does not support the Canvas tag.", then it simply means your browser is not one that supports the HTML5 tag, so refer to the introduction section to learn more about what you should install. Otherwise, you should just see a blank space where the empty Canvas element is.
The code above pretty simple, with only a handful of important things to take a look at. You'll notice first that we load two scripts:
<script language="JavaScript" type="application/JavaScript" src="main.js"></script>
<script language="JavaScript" type="application/JavaScript" src="source.js"></script>
"main.js" is a general wrapper, that will be introduced in the next section, that creates a simple framework for us to draw in. It gives us simplified line-drawing functions, as well as the FPS counter system that gets presented as text into the text field defined later in the document.
The second source file, "source.js", is where all the magic you make will happen! This is the only text file you will be working in, and this entire tutorial revolves around it: if you want, save different versions of the file to keep track of your code changes, and all you have to do is change the filename in the above lines to keep your HTML renderer page updates.
<body onload="Main()">
The above code defines what function to execute (in this case "Main()"), from the previously mentioned source files. Again, the behavior of that function will be defined in the following section, but this is really our true program entry point, where some simple work is done to keep the programming environment easy for you.
<canvas id="SampleCanvas" width="320" height="240">
Frames per Second: <input type="text" name="FPSTextBox" id="FPSTextBox" readonly="readonly" size=10 value="Calculating..." />
The Canvas element, named "sampleCanvas" is our target drawing surface. Everything we do will output strictly to this surface. Though you can change its size, it's best to leave those alone to keep your code and this tutorial's code as similar as possible, to help with debugging later on. The second element, named "FPSTextBox" is our frames-per-second output text field, where it is updated through a simple frames-per-second counter implemented in the starting framework. Notice how it is a read-only field, since we don't want to deal with any sort of user manipulation, as it is a very simple "output" of sorts.
Canvas setup
As mentioned in the previous section, "main.js", will be our generic wrapper framework, that simplifies a few functions that we will commonly use in our tutorial, like drawing pixels, lines, filling in surfaces, etc. Our second source file, "sample.js", will be where all of your code will be written. You can write your code in any way you want, however you want, in that source file, as long as it defines two required functions: "Init()", which is used for your own custom initialization of the scene and/or data, and "RenderScene()", which is where you are expected to do all of your own drawing! The rendering loop is pretty simple: our HTML page, on load, calls a function named "Main()" which is defined in "main.js". This does some internal initialization, which we will discuss shortly. In this function, after it completes its own work, it calls your own initialization function named "Init()". From that point on, the code will keep looping at a target speed of 60 times a second, calling your custom function "RenderScene()".
Note
Why do we "target" a frame-rate speed and not go as fast as possible? Modern Operating Systems are multi-process, meaning that there are multiple processes (applications) running at a time. Since processors typically can't run all of those user processes truly at the same time (processors typically work one step at a time), there is a sort of Time-Sharing / Multitasking manager that gives processes little chunks of time, then work on another process, repeating this so fast that the human user can't tell the difference between fast switching and everything working in parallel. Part of the time-sharing algorithm deals with the computational intensity of applications: the more intensive an application is, the more time is given to it (up to a certain point, so that it doesn't "freeze" the system by consuming too much time, preventing basic and important services from ever working). Thus, if we let our code execute as fast as possible, it would be considered a computationally intensive program and would burden the system more than it really needs to be. Sure, we could execute our code very quickly, over and over again, but there is no benefit to the user since anything past 60 frames per second is not noticeably better to the human eye. Later on we will discuss how 60 FPS is even too high, since the human eye stops seeing still images at around 24 to 30 FPS. In our case, we limit ourselves to be nice to other processes, allow the host Operating System time to do other work, and simply because we don't need to go as fast as possible once past a minimum frame speed.
Since "sample.js" requires you to implement at minimum two functions (the "Init()" for initialization, and "RenderScene()" for drawing work), the below code is a great place to start: It implements everything you need, and even draws a background for you (more on that later). Copy-paste this code into a new text file, save this text file as "sample.js", and make sure to save it to the same directory as your previous saved HTML document.
Download the "source.js" source code here.
function Init()
{
    // Left empty on purpose...
}

function RenderScene()
{
    // Left empty on purpose...
}
Now comes the simple framework of functions we will use throughout this tutorial. "main.js" is left un-minimized (i.e. intentionally verbose sans optimization), to let you read through the code as easily as possible. Though we will be talking about how some of these functions are implemented internally, I leave it up to you to step through the code if you wish to learn more, but essentially all that is being done is a simplification of the HTML5 Canvas rendering functions. What you should take away from the following code are the core drawing functions, which will make more sense after reading through the section on 2D graphics:
function RenderPoint(integer x, integer y, integer width, [integer r,g,b] color)
Draws a single point, of size "width", at the given screen position, of the given color.
function RenderLine(integer x1, integer y1, integer x2, integer y2, integer width, [integer r,g,b] color)
Draws a line, from point (x1, y1) to point (x2, y2), of the given width and color.
function RenderTriangle(integer x1, integer y1, integer x2, integer y2, integer x3, integer y3, integer width, [integer r,g,b] color)
Draws a triangle's outline, from point (x1, y1) to point (x2, y2) to point (x3, y3), of the given width and color.
function RenderFillTriangle(integer x1, integer y1, integer x2, integer y2, integer x3, integer y3, [integer r,g,b] color)
Draws a triangle, from point (x1, y1) to point (x2, y2) to point (x3, y3), filling it with the color.
var ContextHandle
A global variable, which is the canvas handle for the current scene.
var CanvasWidth
A global variable, which is the current canvas width in pixels.
var CanvasHeight
A global variable, which is the current canvas height in pixels.
Download the "main.js" source code here.
/***************************************************************

 3D Tutorial - Core S2 Software Solutions -Copyright 2012
 Learn more at www.cores2.com

 This source file is developed and maintained by:
   + Jeremy Bridon jbridon@cores2.com

 File:
   main.js

 Description:
   Main application entry point; connects to the canvas HTML 5
   element and starts the rendering cycle, managing performance
   and throttling as needed. Also does double-buffering by creating
   and swapping an internal Canvas buffer.

   To interface with this, you must create another JavaScript
   file that implements the "Init()" and "RenderScene()"
   functions.

***************************************************************/

/*** Public Variables (Read Only) ***/

// Global timer used for animations; grows over time
// Measured as fractions of seconds
var TotalTime = 0.0;

// Target frames per second, measured in fractions of seconds
const TargetFrameTime = 1.0 / 60.0;

// Global canvas width and heights
var CanvasWidth;
var CanvasHeight;

// Global screen centers
var CenterX;
var CenterY;

/*** Internal Functions & Variables ***/

// FPS counter, refresh rate, and internal timer
var FrameRateTime = 0;        // Seconds elapsed since last FPS post
var FrameRateCount = 0;       // Number of frames since last FPS post
var FrameRateRefresh = 1;     // Time interval between each FPS post

// Global canvas and graphics handle
var CanvasHandle = null;
var ContextHandle = null;

// Backbuffer canvas handle
var BackCanvasHandle = null;
var BackContextHandle = null;

// Main application entry point; this MUST be called before any other functions
// Calls the user overloaded "Init(...)" function and starts
// the main render loop
function Main()
{
    // Get context handles
    CanvasHandle = document.getElementById("SampleCanvas");
    ContextHandle = CanvasHandle.getContext("2d");

    // Get the canvas size
    CanvasWidth = ContextHandle.canvas.clientWidth;
    CanvasHeight = ContextHandle.canvas.clientHeight;

    // Get the canvas center
    CenterX = CanvasWidth / 2;
    CenterY = CanvasHeight / 2;

    // Create an image backbuffer
    BackCanvasHandle = document.createElement("canvas");
    BackCanvasHandle.width = CanvasWidth;
    BackCanvasHandle.height = CanvasHeight;
    BackContextHandle = BackCanvasHandle.getContext("2d");

    // Call the custom init function
    Init();

    // Start the render cycle
    RenderLoop();
}

// Main render loop
// This should setup a timer at the end to call itself again
// This function throttles itself to only update at a target FPS
function RenderLoop()
{
    // Start timing this render cycle
    var StartTime = new Date();

    // Clear backbuffer
    BackContextHandle.clearRect(0, 0, CanvasWidth, CanvasHeight);

    // Save context state
    BackContextHandle.save();

    // Render the scene
    RenderScene(BackContextHandle);

    // Restore the context state
    BackContextHandle.restore();

    // Swap the backbuffer with the frontbuffer
    // We take the contents of the backbuffer and draw onto the front buffer
    var ImageData = BackContextHandle.getImageData(0, 0, CanvasWidth, CanvasHeight);
    ContextHandle.putImageData(ImageData, 0, 0);

    // End time
    var EndTime = new Date();

    // Measure the difference
    // Note that "value of" returns millis, we divide back into seconds
    var TimeElapsed = (EndTime.valueOf() - StartTime.valueOf()) / 1000;
    var SleepTime = TargetFrameTime - TimeElapsed;

    // If target sleep time is negative, simply don't sleep
    // This is in cases where we take longer than intended to render a scene
    if(SleepTime < 0)
        SleepTime = 0;

    // Calculate the cycle time of how long it took to execute this frame
    var CycleTime = TimeElapsed + SleepTime;

    // Calculate FPS when needed
    FrameRateTime += CycleTime;
    if (FrameRateTime >= FrameRateRefresh)
    {
        // Post FPS
        var FPS = FrameRateCount / FrameRateRefresh;
        document.getElementById("FPSTextBox").value = FPS + " / " + (1 / TargetFrameTime);

        // Reset time and frame count
        FrameRateTime = 0;
        FrameRateCount = 0;
    }

    // Grow frame count
    FrameRateCount++;

    // Callback to self after sleep-off time
    // Note that we convert back to seconds and then set this sleeping function
    TotalTime += CycleTime;
    setTimeout(RenderLoop, SleepTime * 1000);
}

/*** Graphics Primitive Wrappers ***/

// Render a point given a point and a color
function RenderPoint(x, y, width, color)
{
    // Shortext context handle
    var ctx = BackContextHandle;

    // Save context
    ctx.save();

    // Set color
    if(color != undefined)
        ctx.fillStyle = "rgb(" + color.R + "," + color.G + "," + color.B + ")";
    else
        ctx.fillStyle = "rgb(0, 0, 0)";

    // Draw from point to point
    ctx.fillRect(x - width/2, y - width/2, width, width);

    // Revert context
    ctx.restore();

    // Done rendering line
}

// Render a line given two points, a width, and a color
function RenderLine(x1, y1, x2, y2, width, color)
{
    // Shortext context handle
    var ctx = BackContextHandle;

    // Save context
    ctx.save();

    // Set width and cap style
    ctx.lineWidth = width;
    ctx.lineCap = "butt";
    ctx.lineJoin = "round";

    // Set color
    if(color != undefined)
        ctx.strokeStyle = "rgb(" + color.R + "," + color.G + "," + color.B + ")";
    else
        ctx.strokeStyle = "rgb(0, 0, 0)";

    // Draw from point to point
    ctx.beginPath();
    ctx.moveTo(x1, y1);
    ctx.lineTo(x2, y2);
    ctx.closePath();
    ctx.stroke();

    // Revert context
    ctx.restore();

    // Done rendering line
}

// Render a triangle given three points, a width, and a color
function RenderTriangle(x1, y1, x2, y2, x3, y3, width, color)
{
    // Shortext context handle
    var ctx = BackContextHandle;

    // Save context
    ctx.save();

    // Set width and cap style
    ctx.lineWidth = width;
    ctx.lineCap = "butt";
    ctx.lineJoin = "round";

    // Set color
    if(color != undefined)
        ctx.strokeStyle = "rgb(" + color.R + "," + color.G + "," + color.B + ")";
    else
        ctx.strokeStyle = "rgb(0, 0, 0)";

    // Draw from point to point
    ctx.beginPath();
    ctx.moveTo(x1, y1);
    ctx.lineTo(x2, y2);
    ctx.lineTo(x3, y3);
    ctx.closePath();
    ctx.stroke();

    // Revert context
    ctx.restore();

    // Done rendering triangle
}

// Render a triangle given three points, a width, and a color
function RenderFillTriangle(x1, y1, x2, y2, x3, y3, width, color)
{
    // Shortext context handle
    var ctx = BackContextHandle;

    // Save context
    ctx.save();

    // Set width and cap style
    ctx.lineWidth = width;
    ctx.lineCap = "butt";
    ctx.lineJoin = "round";

    // Set color
    if(color != undefined)
        ctx.fillStyle = "rgb(" + color.R + "," + color.G + "," + color.B + ")";
    else
        ctx.fillStyle = "rgb(0, 0, 0)";

    // Draw from point to point
    ctx.beginPath();
    ctx.moveTo(x1, y1);
    ctx.lineTo(x2, y2);
    ctx.lineTo(x3, y3);
    ctx.closePath();
    ctx.fill();

    // Revert context
    ctx.restore();

    // Done rendering triangle
}

// Render a checkered background (Colors are set internally)
function RenderBackground()
{
    // Shortext context handle
    var ctx = BackContextHandle;

    // Draw a checkered light background
    var SquareSize = 8;

    // Draw an error background
    ctx.fillStyle = "rgb(8, 32, 128)";
    ctx.fillRect(0, 0, CanvasWidth, CanvasHeight);

    // For each screen chunk
    for (var y = 0; y < Math.floor((CanvasHeight + SquareSize) / SquareSize); y++)
    {
        for (var x = 0; x < Math.floor((CanvasWidth + SquareSize) / SquareSize); x++)
        {
            // Select the color based on positions
            var TargetColor = { R: 175, G: 175, B: 175 };

            // If we are in a lighter square positions, make color lighter
            if (x % 2 != y % 2)
                TargetColor.R = TargetColor.G = TargetColor.B = 235;

            // Render recntagle
            ctx.fillStyle = "rgb(" + TargetColor.R + "," + TargetColor.G + "," + TargetColor.B + ")";
            ctx.fillRect(x * SquareSize, y * SquareSize, SquareSize, SquareSize);
        }
    }

    // Done rendering background
}
Note
You'll probably be wondering why do we have two canvas and context handles, and why are they called foreground and background, respectively? This is done to implement a Back-buffer / Frame-buffer. Back-buffering will be discussed in detail later, but to those eager to understand, it is a way to buffer all of our drawing code into a hidden surface, then present that as a whole to the user. It prevents the users from seeing parts of geometry being drawn step-by-step since drawing is not instantaneous, so we batch up our drawing commands and only display the final results once all drawing is complete.
Thus far, you should have three files in your tutorial folder: index.htm, main.js, and source.js. Make sure that you have all of these and that at minimum you see an HTML document with a blank canvas in the middle.
Before moving on, let's give you a taste of what's to come: we're going to implement a very simple line-rotation effect! In your "source.js", within the "RenderScene()" function, copy-paste the following code:
function Init()
{
    // Left empty on purpose...
}

function RenderScene()
{
    // Render the background
    RenderBackground(ContextHandle);

    // Find the center of the image
    var CenterX = CanvasWidth / 2;
    var CenterY = CanvasHeight / 2;

    // Render some rotating lines
    var TotalLines = 5;
    for(var i = -TotalLines; i <= TotalLines; i++)
    {
        // Find offset corners
        var OffsetX = Math.cos(TotalTime * i * (0.25 / TotalLines)) * 100;
        var OffsetY = Math.sin(TotalTime * i * (0.25 / TotalLines)) * 100;

        // Set a color then draw line
        var Color = {R:16, G:128, B:256};
        RenderLine(CenterX - OffsetX, CenterY - OffsetY, CenterX + OffsetX, CenterY + OffsetY, i, Color);
    }
}
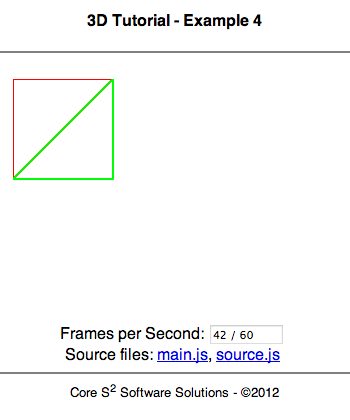
Once pasted, save your changes, and reload the HTML document. You should see the following:
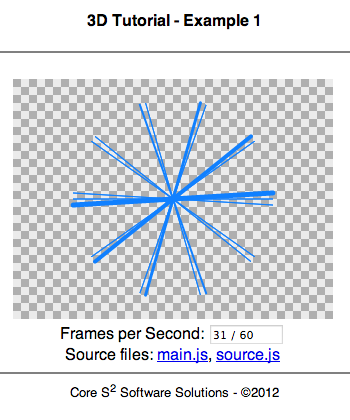
What you should be seeing: a series of animated blue lines of varying thickness rotating about the center.
The code is pretty simple to follow when written in plain-english: we first find the center of the screen, then for 10 lines, we compute a position that is rotating around the center at a fixed distance, and finally we render these lines based from this position towards a reflected position (across the X and Y axis). Don't worry about understanding all of this just yet, since this is a very arbitrary example to get you drawing immediately. The idea here is to make sure your programming environment works!
checkpoint
2D Graphics
To create a 3D rasterization renderer, we must understand where we are going to actually draw the 3D! In our case, we will be drawing on simple and small 2D surface, so let's dive straight into 2D computer graphics:
Pixels
So what is a pixel? It is a simple graphical primitives much like a "dot of color" in an image. When many pixels are placed on a grid, an image can be generated. Pixels can either mean the conceptual "basic single color square" concept found in digital images, or can mean the physical color component in a device like a TV, LCD monitor, etc. In our case, we care about the virtual pixel, since we will be writing to a 2D image in a browser.
Pixels, in the digital world, can represent color by a combination of color channels: a combination of red, green, and blue (referred to as the RGB color model, though sometimes other color models exist), can be used to produce a unique color. Based on the range of each channel, we can represent thousands, millions, and easily billions of colors! Computers, being digital, represent each color value, or intensity, as an integer, commonly from 0 to 255. Thus, each color is a single "byte" of digital information. Three of these bytes, and a fourth byte representing alpha (transparency), comes to a total of 32-bits, which is where the term "32-bit color depth" comes from. There are of course other ways to represent color values, though most common and most simple to understand is this integer color depth. As an example, black, which is the sum of no intensities, can be represented by (0, 0, 0), or 0 intensity for red, 0 intensity for green, and 0 intensity for blue. White, on the other hand, is the sum of full intensities, and thus can be represented by (255, 255, 255). Note that as just mentioned we can represent colors in other ways: another very common way is to represent the range through a floating-point value between 0 and 1, thus black is still (0, 0, 0), but white is now (1, 1, 1). Remember, combinations are what produces all other colors: Purple can be represented as (159, 0, 197), using the 32-bit scheme.
Pixels are not only color values, but also positions. All 2D images can be mapped by coordinates using the cartesian coordinate system, but the conventions and origin of such a system depend on the framework and conventions you are using. OpenGL uses the left-hand coordinate system: the X and Y origin are in the bottom-left of your screen, with the X position growing towards the right, and the Y position growing upwards. Z, the third dimension since OpenGL is a 3D framework, grows from the viewer and into the screen, but this is irrelevant to us until later. DirectX uses a right-handed coordinate system, thus the Z axis grows towards the screen from the user.
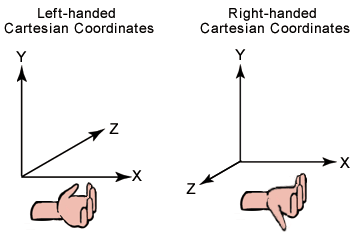
The terms "left handed" and "right handed" define where the Z axis grows towards: take your hand, and curl it from the X-axis towards the Y-axis. Wherever your thumb points to, is the direction of the Z axis for the respective system. Taken from MSDN Direct X 9 documentation.
In our case, Canvas is a little different: the origin is in the top-left, with X growing to the right and Y growing to the bottom. Later on, when we define our 3D world, we will use the left-hand notation.
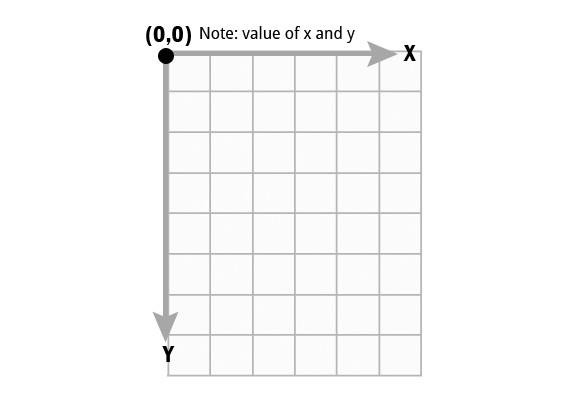
The origin (0,0) is in the top left, with the point (100, 0) on the top-right, (0, 100) on the bottom-left, and (100, 100) in the bottom-right.
Let's do an example: say we want to draw a 100 points randomly across the screen every time we have our RenderScene(...) function called: though it'll look like a random static image (similar to old analog TV's when you set the channel to an empty station), the idea here is to just draw pixels at random locations.
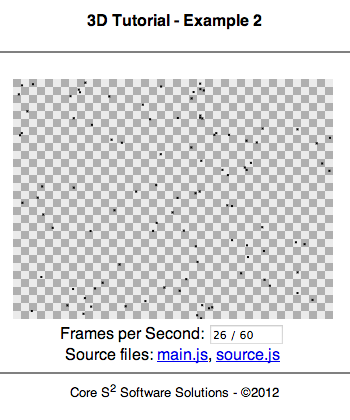
What you should be seeing: a series of random dots appearing and disappearing.
// Custom init function for this demo
function Init()
{
    // Nothing to initialize
}

// Main render scene function; called by the RenderLoop() cycle
function RenderScene()
{
    // Render the background
    RenderBackground(ContextHandle);

    // For 100 points
    for(var i = 0; i < 100; i++)
    {
        var x = Math.random() * CanvasWidth;
        var y = Math.random() * CanvasHeight;

        RenderPoint(x, y, 2);
    }
}
checkpoint
Lines
Lines are the next step up in the 2D world from pixels: they are a series of pixels that fill the distance between two points. When it comes to computer graphics, drawing lines is a critically important basis for any 3D renderer: it can help with the actual rendering itself, with GUI rendering, debugging, etc. Though conceptually a trivial idea, lines are remarkably complex to implement as efficiently as possible in software. That is to say that lines are easy to draw, using the slope-intercept formula, but the easiest (trivial) solutions tends to be slow, and the most efficient approaches are quite complex to understand. Fortunately for us, Canvas abstracts line rendering and provides us a friendly function (with which we wrap in our own simplified call in "main.js"). If you are interested in the challenge of implementing a line rendering function, read both this fantastic article on real-world results from line drawing, and the Wikipedia article on line drawing algorithms (the Wikipedia article is great since it also shows good pseudocode).
What you should understand, and hopefully appreciate, is that the basic line renderer algorithm shouldn't be used this since it is a naive and slow approach, and that our framework code directly calls the Canvas implementation of line-drawing, which should be very fast.
Note
Algorithms and computational complexity are important subjects well outside of the scope of this article, but are enormously important for any and all software projects. A simple but clean-cut definition of an algorithm is that it is a series of steps to take to deal with some sort of input, and give you a desired result. Computational complexity is how easy or hard, relative to known categories, a given algorithm or process is to execute. All of this is relevant to you, because programming is essentially writing an algorithm in a formal computer-programming language. Computational complexity is also critically important to you because computer graphics can be a computationally intensive problem, and thus being aware of fast algorithms and complexity classes can result in better performance. In-fact, as you will see later in this tutorial, you can swap some functions' implementations (i.e. change their algorithms) for massive speed increases, or use significantly less memory, or gain other benefits! We choose not to use the "best" algorithm, since naive approaches may be slow but are very easy to understand. If you are able to master algorithms and computational complexity as a subject matter, not only does that make you a good developer, but makes you a top-notch software engineer!
As an example, let's draw a single line that has one point go from the origin, and another point rotate around the middle of the screen. This will require some basic trigonometry to compute the position on a circle's radius, which represents rotation around the center of the image, but it's nothing hard:
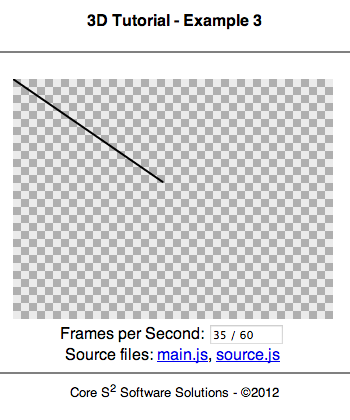
What you should be seeing: a line that has the second point rotating around the center over time.
// Simple growing variable
var Time = 0.0;

// Custom init function for this demo
function Init()
{
    // Nothing to initialize
}

// Main render scene function; called by the RenderLoop() cycle
function RenderScene()
{
    // Render the background
    RenderBackground(ContextHandle);

    // Grow time
    Time += 0.1;

    // Compute screen centers
    var CenterX = CanvasWidth / 2;
    var CenterY = CanvasHeight / 2;

    // Draw a line from the origin (0, 0) to a position on a circle around the center
    RenderLine(0, 0, CenterX + Math.cos(Time) * 20.0, CenterY + Math.sin(Time) * 20.0, 2);
}
checkpoint
Triangles & Polygons
Triangles are the next important drawing primitive in our computer graphics toolkit! Triangles are powerful for two important reasons in the world of computer graphics: they are the simplest space-filling shape that can be drawn with beneficial geometry properties, and that they can be filled quickly by a computer! Triangles, being only composed of three points, can never overlap itself, unlike a n-point polygon, where n is greater than 3. This allows the computer to not have to check for any special cases of wether or not to fill a given pixel, and it also allows the computer to just fill a single row, being guaranteed that each row of pixels filling a triangle only have one continuous row, and never more. This way when complex shapes like n-point polygons are needed, you can just render it out as a series of triangles, and not worry about developing complex n-point polygon rendering code. Triangle filling also has the advantage of being done very quickly due to hardware acceleration: graphics cards are great at doing many smaller tasks (like filling a row of pixels in a triangle) in parallel!
Triangles also have a nice property in the 3D world: you can move the triangle's points in any way you want in 3D-space, in infinite combinations, but triangles will never "fold" on themselves, unlike more complex shapes like rectangles or polygons. This guarantees that an object made of triangles in 3D space will always be "solid" and consistent, which more simply means that the behavior in any case will be clearly defined, and that a triangle always has a correct "facing" direction.
To show that using squares for basic surfaces in 3D-space, consider this thought-experiment: imagine a simple 10 by 10 inch square object, completely flat, floating in space, where the edges are solid but the corners allow edge movement. This square, by definitions, has four points. Pick two points, opposite of each other and leave the two remaining points alone. Try to pinch the two points you've selected, while the remaining two points stay in the same position, and while you are moving the pinched-points towards you. It will look like two triangles, like a folded square napkin, where the base of the two triangles are connected (the two points you left stuck in space), and the two points you took to pinch are pointing towards you. Now ask the critically important question: what is the "surface" of this geometry? Is it one of the two triangle planes facing one-another, or is it one of the two planes facing away? If it is either of these two, which of the surfaces is the correct surface, since they point in different directions? The simple fact is, n-point polygons (n being more than 3) leads to too many undefined behaviors when moving around, thus we use triangles because they are always consistent. You'll learn quickly that all polygons, and thus all models, can be represented by a series of triangles. Thus, this thought-experiment could be re-done with two triangles from the start, which is perfectly fine when it comes to the rendering mechanisms, because that square won't be seen as a square, but will be seen as two triangles to render, which for the computer makes a world of difference.
See how when we pinch and stretch away points on the square, there are some weird rendering behaviors? Rendered in Blender.
Triangle filling is another critical feature of triangles: as previously mentioned, it can be easy and fast to fill a triangle, and many methods exist. Texturing a triangle, discussed later, is more challenging, but is still computationally fast because triangles are, by definition, convex. Thus, the filling code doesn't have to check at run time if it is ever out of bounds of the geometry; it can start filling from left to right, being guaranteed not having to do any more work! This small property gives a big run-time boost! There is a great University of Utah article from their Computer Science department on this topic, well worth a read if you are interested in a reading through a clean and concise solution.
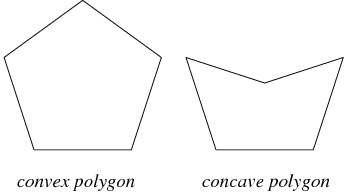
Convex polygons can have any two points connected without every intersecting the polygon's edge. This small property is critically important in the hardware speedup for triangle filling algorithms.
Let's draw a square using two triangles: a trivial proof-of-concept to show that two triangles can form more complex shapes:
What you should be seeing!
// Custom init function for this demo
function Init()
{
    // Nothing to initialize
}

// Main render scene function; called by the RenderLoop() cycle
function RenderScene()
{
    // Render the background
    // Removed to better show the triangle crease / collision
    //RenderBackground(ContextHandle);

    // Draw triangle one: top-left, to top-right, to bottom-left (red)
    RenderTriangle(0, 0, 100, 0, 0, 100, 2, {R:255, G:0, B:0});

    // Draw triangle one: top-right, to bottom-right, to bottom-left (green)
    RenderTriangle(100, 0, 100, 100, 0, 100, 2, {R:0, G:255, B:0});
}
checkpoint
Images
Images are simply a two dimensional array of colored pixels. This means that it is a grid, of a given size, that has a data format for each pixel. This format is usually 32-bits per pixel, as mentioned above, with each color channel represented by a byte (8-bits) as an integer from 0 to 255). Images are important to us because we can use them as textures for 3D models and surfaces: rather than drawing a triangle with a single solid color, we may want to have a texture associated with it, giving it more detail, and that can only be done if we have a source image (though you can create images as-needed with procedurally generate images or textures).
Images exist in many file formats, but the two main categories are raster images / bitmaps, or a vector formats. Raster images are just a grid of pixels, which if you zoom into have a finite set of data. Vector images are image are defined by geometric primitives, and if zoomed into, never lose detail. Though both can be used in computer graphics, usually 3D rastering frameworks use raster images because it is easier to map image pixel data to screen-space pixel data. Vector images can be used, but have to be "sampled" at run-time (i.e. converted to a bitmap, then used).
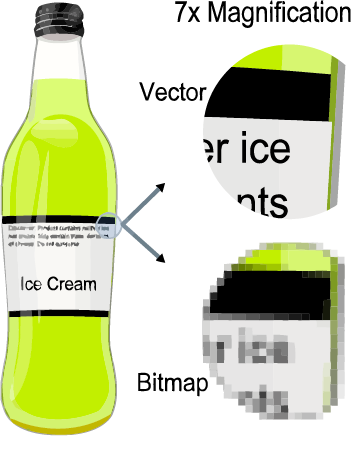
Difference between raster / bitmap images and a vector image. Taken from Wikipedia's article on Vector Graphics.
Note
Raster / bitmap image file formats also vary widely, but again fall into two major categories: Lossy compression and Lossless compression. The tradeoff between the two is accuracy and file size, but it's an important difference to know especially if you are working on graphics for an embedded system where memory is smaller or the processor/platform doesn't have good decompression support.
Screen & Double Buffer
When drawing directly to a surface, you will be reading and writing data step-by-step. This is to say that if you were to draw three lines, but look at the screen between each drawing event, you will literally see one line drawn at a time. HTML5 Canvas might batch your drawing commands, based on your browser's implementation, but advanced graphics libraries like OpenGL and DirectX certainly don't. This is just the nature of how graphics libraries work: if you give a draw command, unless you are directly using a batching feature, it will be executed immediately. This may seem unimportant, but if you were to draw your scene where you need to do work between drawing different features, the user may see odd rendering behavior: users may actually see objects being drawn one after the other, ruining any illusion of animation! Even if you had a rendering system so fast that users couldn't see the rendering steps, the screen must be cleared for rendering the next frame. Thus, users only see for a fraction of time the complete image, since as soon as the complete image is presented, your program clears the screen space for the next scene. Some systems, especially with HTML5 Canvas, will not stop showing an image while you are working on it. This means that in our case, more so than others, we must be aware that at any point anything we draw, even if not completed, can be shown to the user. We don't even have a locking mechanism provided by JavaScript, and even if we did we wouldn't want to stall the application just to finish our work (this goes back to an earlier note about playing nice with the host Operating System). Instead, we use "double buffering"
To resolve this, what we do is render your scene into a second screen buffer, invisible to the user. By doing this, we let the user see the previous image for as long as possible, and only when our next image is truly complete, do we swap the screens and show the completed screen. Then your code is free to trash what was previously seen by the user because that screen is no longer used. Simply put: your code should only draw to a surface that isn't visible to the user, because drawing takes time, but when you are done, you swap your screens, since screen-swapping is very quick. This prevents a "stuttering" image, or an image that flickers. You in turn maximize the amount of time the user sees a full image, and minimize the transition time between images. This is all called double buffering.
3D Graphics
We are finally at the meat and potatoes of this entire article: prepare for some fun code, lots of exercises, and actually getting some real 3D rendering going on!
Coordinate System
By definition of 3D space (three-dimensional space), we have three axes of freedom to move in: X, Y, and Z. This means that, relative to the observer, a point can move left-right, up-down, and towards-or-away from your view. In our program, our goal will be to take 3D geometry (points, lines, triangles, and eventually meshes), and convert them (formally called "mapping" or "projection") into 2D space. For this to be done, we need to know where the given geometry is, and where we want to view it from. That's all we need to know to get working! To keep our systems clean and consistent, we will use the OpenGL left-hand 3D coordinate system, where positive-X grows to the right, positive-Y grows up, and positive-Z grows from the observer into the screen. We will also use the forced Canvas convention for the 2D coordinate space system: the origin is in the top-left, with positive-X growing to the right, and positive-Y growing to the bottom.
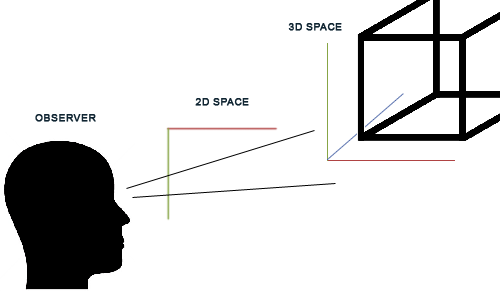
The global coordinate system: 3D space, as seen by the observer, through a 2D space.
View Projection
So how exactly do we "map", or "project", from 3D space into a 2D coordinate system? There are a variety of methods to do 3D projection, each used for different purposes. Orthographic projection simply removes the Z component of all geometry, and draws just their X and Y components onto the 2D surface. Though simple and easy, this creates a very odd result: no matter how far or how close the object is, it appears the same size! This is because in the real world, we have a visual perception of distance based on objects being bigger when they are close, and smaller when they are far. This is formally called visual perspective, and is exactly what we want to implement.
Note
Using different projection methods really are important for a variety of applications. Orthographic project, where you see objects "head on" without any scaling changes based on distance, is critically useful when designing mechanical components in CAD (computer aided design / drafting) software. This is because you can precisely manipulate how parts are to be manufactured as though you are working on a 2D piece of drafting paper. Other projection methods, like isomorphic projection, are useful in video games where you may need depth as an in-game element, but do not want to present it as a visual elements: this is a style common in the SNES-generation of games. Perspective-projection is the standard 3D rendering mechanism.
Fortunately for us, perspective projection only requires a trivial amount of extra work: the size of geometry is multiplied by the inverse of distance, multiplied by your field-of-view. Field-of-view is your visual range: how wide you can see. Humans typically have about a 100 to 180-degree view in front of us, while some animals (birds) have nearly a 360-degree view. This, by definition, affects how much we see around us without moving our heads, and thus if you field of view is big, we then see more, and have to put more on-screen, so we multiply the inverse distance by this factor so that we can "crunch" more of our 3D visible space into the 2D space.
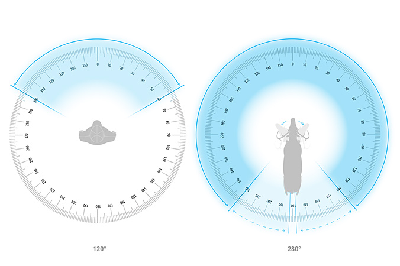
The average human's field of view compared to that of a horse.
Now, we can directly apply the perspective projection to convert the 3D points to 2D points, but there is still an important open-ended question: how to we deal with camera movement, for both rotation and translation? This part does take some substantial knowledge of linear algebra, but we can at minimum describe it in simplified english: we take the camera movements and apply the inverse behavior to all 3D models, then apply the 3D to 2D project. Think about this, as an example of why this works: if you look at a TV screen, and move your head to your right, relative to your perception, the TV is moving to the left. If you rotate your head clockwise while looking at a TV screen, relative to your perception, the TV is rotating counter-clockwise. So all we have to do in code to deal with these movements is to apply the opposite effect. Yet, how do we implement this in math and eventually in code? Well, as just mentioned, we will have to use linear algebra (or at minimum the simplified algebraic expressions).
a2D = (a3D / distance) x (field of view)
Simplified perspective projection, to get us started.
Point
First thing first: we are going to take a 3D point, before any sort of application of projection or movement, and define it as the variable named "d", with the three-component subscripts of "dx, dy, dz". We first take this point, then rotate it about each of the axes individually. You'll notice shortly that there is an important order to this process, and it is due to the nature of multiplication / order-of-application associated with linear algebra. After this rotation, we can then apply translate: i.e. movement. Finally, at the very end, we apply the projection factor, which is the equation marked above. Wikipedia has a great graphic that shows this math in a formalized form:

The formal camera-transformation function, in linear algebraic form, for all geometry. Link to original article from Wikipedia.
Now this equation, since it is in linear algebraic for, might seem immensely intimidating, but don't let that bother you! The following is the exact same maths, but in a simplified, less formal but more reader-friendly, form:

The formal camera-transformation function, in simplified algebraic form, for all geometry. Link to original article from Wikipedia. Note: in our code, we will simplify these terms into more readable forms!
To help you, before coding this up, let's clarify the variable names and what they mean for a scene: as previously mentioned, "dx, dy, dz", is the point in question we are trying to convert from 3D-space to a camera-corrected position. The subscripts represent the position-components of the 3D position that the point has. The variable a, with the form "ax, ay, az", is the original position of the point. Essentially d is the result, and a is the original position. The variable c, with the form "cx, cy, cz", is the camera's position. Look at the right of the linear-algebraic form: you will notice that we multiply our rotations by the distance between our 3D point and our 3D camera: this is all about moving the point in the opposite position that the camera is in. The variable theta (using Unicode: "Θ"), represents the rotation, about the respective axes, of the camera. This means that, based on our 3D coordinate system, if thetax (again, using Unicode: "Θx") is set to 45-degrees, we are rotating the camera around the x axis, pitching down (looking down) by 45-degrees.
Finally, once we have dealt with position rotation and translation, we need to apply our project to convert from this correct 3D point to a 2D screen point:
Screenx = (dx / dz) x (field of view)Screeny = (dy / dz) x (field of view)
Apply the final step in 3D to 2D projection: note how we divide not by distance, but by z? It is the same thing! We moved the 3D geometry into the correct position, thus the z-value for all positions are truly the distance from the camera.
Hopefully thus far you haven't been lost with the math, though stick with it! I freely admit when I started doing all of this 3D programming myself, I struggled over and over again until I got further into the implementation of this all into code, which is what we will now tackle.
Load your text editor, and open the "source.js" source file. We are going to define the cube geometry, which consists of 8 points, with each point have three components (x, y, and z). JavaScript is great because it allows us to define both the data, and the data's structure, all at once! Create a new variable named "CubeVertex" in which we define an array of triple-floats (in global scope, so define it outside of a function). It should look like the following:
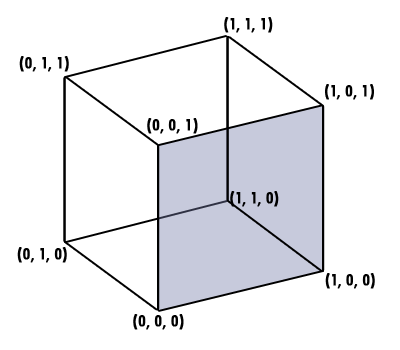
A sample cube with each vertex labeled. The grey surface is the "front" of the cube.
// Cube vertex data
var CubeVertex =
[
    {x:-1, y:-1, z:1},
    {x:-1, y:1, z:1},
    {x:1, y:1, z:1},
    {x:1, y:-1, z:1},
    {x:-1, y:-1, z:-1},
    {x:-1, y:1, z:-1},
    {x:1, y:1, z:-1},
    {x:1, y:-1, z:-1},
];
From here, we also need to define the camera's properties, which includes the position, field-of-view, and later on in this text the rotation.
// Camera position
var CameraPos = {x: 0, y: 0, z: -10};

// Camera distortion
var RatioConst = 32;
For now, let's implement the renderer without any rotation (as just mentioned), and have the cube be centered on-screen, as seen head-on:
function Init()
{
    // Nothing to initialize
}

function RenderScene()
{
    // Render the background
    RenderBackground(ContextHandle);

    // Find the center of the image
    var CenterX = CanvasWidth / 2;
    var CenterY = CanvasHeight / 2;

    // For each vertex point
    for(var i = 0; i < CubeVertex.length; i++)
    {
        // Convert from x,y,z to x,y
        // This is called a projection transform
        // We are projecting from 3D back to 2D
        var ScreenX = (RatioConst * (CubeVertex[i].x - CameraPos.x)) / CubeVertex[i].z;
        var ScreenY = (RatioConst * (CubeVertex[i].y - CameraPos.y)) / CubeVertex[i].z;

        // Draw this point on-screen
        RenderPoint(ScreenX + CenterX, ScreenY + CenterY, 3);
    }
}
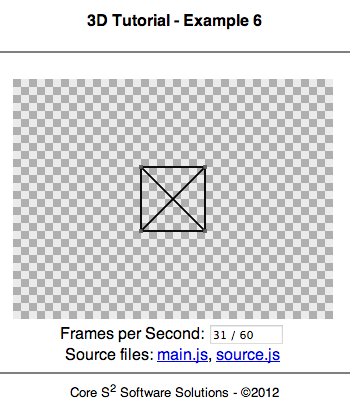
Notice how we have to add the "CenterX" and "CenterY" to each position? This is again done so that we move what the camera sees onto the center of the screen. As an experiment, leave it empty, and see the results: the cube will now be centered in the top-left of the screen, which is the true origin of our screen. Save your changes, and open your "index.htm" page or reload it. You will see 4 distinct points, which are the 8 points of the cube seen head-on (note how there are truly 8 points on-screen: every other point is paired on top of each-other because there has been no rotation, and the object isn't long enough to distinguish between the front and back points through projection distortion). If you are unable to see anything, make sure that the "index.htm" source is correctly loading your Javascript source file.
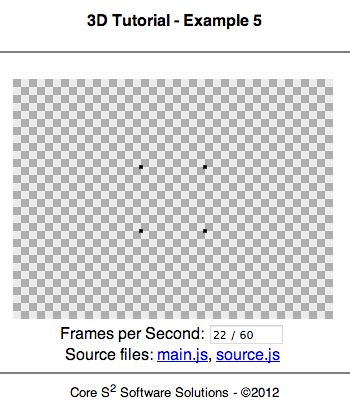
What you should see on your screen.
checkpoint
Geometry
Before tackling rotation, which will come shortly, let's render a wireframe version of our cube: we must define a new array, named "CubeEdges" that tell the renderer which points of the cube should be connected with other points, forming the cube "edges".
// Cube edge data
var CubeEdges =
[
    {i:0, j:1},
    {i:1, j:2},
    {i:2, j:3},
    {i:3, j:0},

    {i:4, j:5},
    {i:5, j:6},
    {i:6, j:7},
    {i:7, j:4},

    {i:0, j:4},
    {i:1, j:5},
    {i:2, j:6},
    {i:3, j:7},
];
Instead of what we did in the previous code, where we directly rendered the point on-screen after converting it from 3D to 2D, we will instead save these points and then use their locations when rendering lines from the "CubeEdges" list.
// Create an on-screen point list we will be working with
var PointList = new Array();

// ... Previous code here ...

// In the "For each vertex point" for-loop, replace the last line that rendered a point to:
PointList[i] = {x:CenterX + ScreenX, y:CenterY + ScreenY};

// ... After the above-mentioned loop, add our line iteration loop: ...

// For each edge
for(var i = 0; i < CubeEdges.length; i++)
{
    // Find the two points we are working on
    var Point1 = PointList[CubeEdges[i].i];
    var Point2 = PointList[CubeEdges[i].j];

    // Render the edge by looking up our vertex list
    RenderLine(Point1.x, Point1.y, Point2.x, Point2.y, 1);
    RenderPoint(Point1.x, Point1.y, 3, {R:100, G:100, B:100});
    RenderPoint(Point2.x, Point2.y, 3, {R:100, G:100, B:100});
}
What you should see on your screen!
checkpoint
Finally let's tackle cube-rotation animation! We will be using the exact same code as lesson 2, but instead of doing our simplified projection function, we will implement the full rotation equation, which is a bit more complex, but again do your best to read and understand each new block of code line-by-line. The two big changes we will introduce are 1. the camera rotation variable, and how that grows over time, and 2. the application of the rotation algebra. Note that for the sake of our demo, we are rotating the cube's point positions, and not the actual camera. There is no mathematical differences, but it does keep our code more simple and readable.
// 1.1: Add the new global camera rotation variable:
//      This should be in global scope

// Camera rotation (Pitch, yaw, roll)
var CameraRot = {x: 0, y: 0, z: 0};

// 1.2: Add the growth of the camera rotation (so we keep rotating every time we render our scene)
//      This should be in the beginning of our "RenderScene()" function

// Slightly grow the rotations
CameraRot.x += 0.02;
CameraRot.y += 0.02;
CameraRot.z += 0.02;

// 2.1: Apply the rotation, for each axis
//      This should be right above where we applied the projection transformation

// Apply rotation onto the vertex
var Temp = WorkingVertex.z;
WorkingVertex.z = -WorkingVertex.x * Math.sin(CameraRot.y) - WorkingVertex.z * Math.cos(CameraRot.y);
WorkingVertex.x = -WorkingVertex.x * Math.cos(CameraRot.y) + Temp * Math.sin(CameraRot.y);

Temp = WorkingVertex.z;
WorkingVertex.z = -WorkingVertex.y * Math.sin(CameraRot.x) + WorkingVertex.z * Math.cos(CameraRot.x);
WorkingVertex.y = WorkingVertex.y * Math.cos(CameraRot.x) + Temp * Math.sin(CameraRot.x);

Temp = WorkingVertex.x;
WorkingVertex.x = WorkingVertex.x * Math.cos(CameraRot.z) - WorkingVertex.y * Math.sin(CameraRot.z);
WorkingVertex.y = WorkingVertex.y * Math.cos(CameraRot.z) + Temp * Math.sin(CameraRot.z);

// Apply camera translation after the rotation, so we are actually just rotating the object
WorkingVertex.x -= CameraPos.x;
WorkingVertex.y -= CameraPos.y;
WorkingVertex.z -= CameraPos.z;

// 2.2: Apply the projection transformation
//      This is where the original 3D to 2D two lines of code are in the vertex iteration for-loop

var ScreenX = (RatioConst * (CubeVertex[i].x - CameraPos.x)) / CubeVertex[i].z;
var ScreenY = (RatioConst * (CubeVertex[i].y - CameraPos.y)) / CubeVertex[i].z;
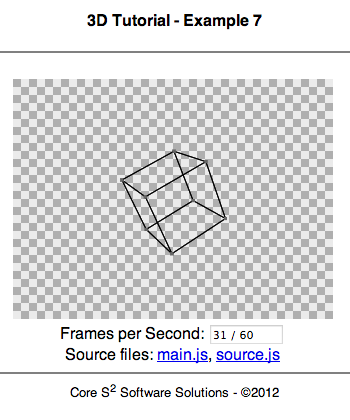
What you should see on your screen! Note that the cube should be rotating.
checkpoint
Note
Trigonometric functions are computationally intensive: they are non-trivial functions that require a bit of work for the computer to do. Classically, computers only take a "step" or two to execute simple math functions, like addition or multiplication, yet functions like Sine and Cosine take much more time because those functions have to execute complex estimation algorithms. Nowadays, these functions are relatively fast, either because of software optimizations, such as using a table-based estimations (i.e. the function just looks up pre-computed values), or because the functions use specialized hardware features within the processor. If you ever need to implement your own trigonometric functions because you believe there are speed issues, be aware that you will have to find a balance between slow-but-accurate and fast-but-inaccurate! On a somewhat related note, the square-root function is commonly used in graphics programming, and there are methods to estimate their results much more quickly than traditional implementations provide. Square-roots are, much like other math functions, generally hardware-accelerated.
Mesh
I've mentioned in this article several times how important triangles are because of their special properties as mesh primitives. Let's go ahead and convert our edge-based "wireframe" system into a more correct triangle system, so that we can eventually tackle the problem of rendering a surface! Similar to the edge definition system, where we refer to vertices through their vertex index, we will now define a triangle as three indices. Note that such a 3D model is sometimes referred to as a "mesh", which defines both the model's vertices, and the surface (generally through triangles).
// 1. We replace our "CubeEdge" definition with "CubeFaces"
//    This should be in global scope; in the same scope as "CubeFaces" once was

// Cube face data
var CubeFaces =
[
    // Front
    { a:0, b:1, c:2, i:1 },
    { a:2, b:3, c:0, i:1 },

    // Top
    { a:1, b:5, c:6, i:2 },
    { a:6, b:2, c:1, i:2 },

    // Back
    { a:5, b:4, c:7, i:3 },
    { a:7, b:6, c:5, i:3 },

    // Bottom
    { a:4, b:0, c:3, i:4 },
    { a:3, b:7, c:4, i:4 },

    // Right
    { a:3, b:2, c:6, i:5 },
    { a:6, b:7, c:3, i:5 },

    // Left
    { a:0, b:5, c:1, i:6 },
    { a:0, b:4, c:5, i:6 },
];

// 2. Replace the entire edge iteration for-loop with the following:
//    This should be in your "RenderScene()" function

// For each face
for(var i = 0; i < CubeFaces.length; i++)
{
    // Find the four points we are working on
    var PointA = PointList[CubeFaces[i].a];
    var PointB = PointList[CubeFaces[i].b];
    var PointC = PointList[CubeFaces[i].c];

    // Render the face by looking up our vertex list
    RenderTriangle(PointA.x, PointA.y, PointB.x, PointB.y, PointC.x, PointC.y, 2);
}
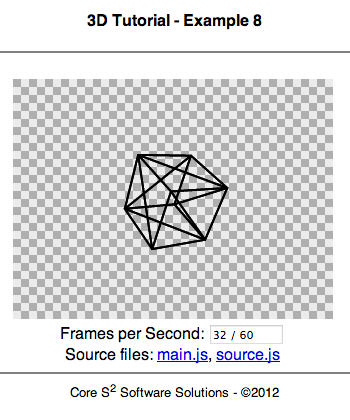
What you should see on your screen! Note that the cube should be rotating.
checkpoint
Complex Geometry
How do we deal with more complex geometry? Turns out you already have everything you need! The existing code-base is ready to parse any number of vertices and surfaces (as long as those surfaces are triangles). As a fun proof-of-concept exercise, let's render the Blender Monkey. Our code only has to change slightly: we first remove all of the cube model information, and instead read the large monkey model data.
// 1. Change the camera position to better see the output model:

// Camera position
var CameraPos = {x: 0, y: -1, z: -5};

// 2. Change the actual model data
// ... Please load the text from the checkpoint source code (too big to include here) ...

// 3. When rendering the model's faces, note that we have to subtract 1 from the indices:
//    Note: Source data starts at index 1 ... n, not 0 to n - 1, so we -1
var PointA = PointList[CubeFaces[i].a - 1];
var PointB = PointList[CubeFaces[i].b - 1];
var PointC = PointList[CubeFaces[i].c - 1];
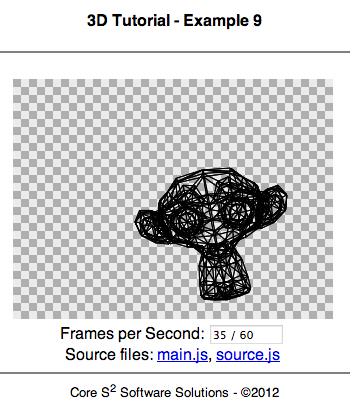
Blender's monkey-face (Suzanne)! If you want, you may choose to continue using this model in the article's code, but be warned: there are 968 triangles in this model, and performance will be terrible!
As an exercise, I leave you with the challenge to write an object-file parser. Object files, ending in *.obj, are a very simple plain-text mesh encoding system, where mesh data is saved as a series of vertices and indices. You should be warned that object files sometimes mix 3-point and 4-point surface primitives, yet in our case we only support 3-point primitives. Either change the file by hand, or write code to handle this. Also, be warned that since this article is all based on a software renderer, any model that has a decent amount of triangles will be very very slow to render.
Note
There are a couple of "famous" 3D models you will find commonly used across platforms and frameworks: these include the Utah Teapot, the Stanford Bunny, and the Cornell Box. Each is famous for being used to introduce or demo important 3D computer graphics technologies in academic publications.
checkpoint
Solid Mesh
Tired of wireframes? Replace all of the "RenderTriangle(...)" function calls with "RenderFillTriangle(...)"! Since we want to differentiate between each surface, instead of rendering each triangle as black (so that the entire cube looks the same), we will vary the color using a simple little modulo operation applied to the iterator variable and a factor. This guarantees that the colors will be unique for this demo.
// ... This code should replace the pair of "RenderTriangle(...)" function calls ...

// Generate a unique face color
var Color = {R:(CubeFaces[i].i * 50) % 255, G:(CubeFaces[i].i * 128) % 255, B:(CubeFaces[i].i * 200) % 255};

// Render the face by looking up our vertex list
RenderFillTriangle(PointA.x, PointA.y, PointB.x, PointB.y, PointC.x, PointC.y, 2, Color);
RenderTriangle(PointA.x, PointA.y, PointB.x, PointB.y, PointC.x, PointC.y, 1);
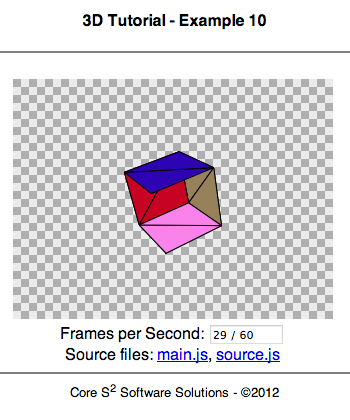
What you should see on your screen! Note that the cube should be rotating. Also note that the sorting error is normal, and to be discussed next.
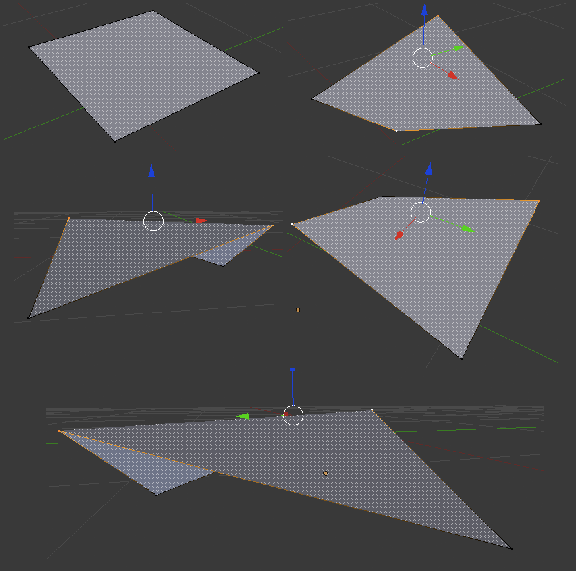
Whoa! What in the world!? Don't panic! The error you are seeing, where faces are incorrectly placed behind each other, is 100% normal and a great segue into the next section: the depth problem. What is going on is that we are rendering our triangles in the order we defined through our original triangle geometry list, but this order is not correct since we may view the object from behind or at different angles. Why should where we view the object matter? Well, since Canvas is a 2D surface, it maintains no depth, and thus whatever is drawn fist gets covered by anything drawn next. This is called the "painter's problem", and we will discuss how to better choose which triangles to render first!
checkpoint
Surfaces
To create the illusion that our objects are solid, we must render the a model's surfaces. We can do this by defining a series of triangles (or polygons) representing the surfaces of an object, just as before. This is called a mesh, and with rasterization we might render triangle surfaces out of order, leading to that bizarre bug seen just before. To solve this problem, we have to investigate into depth-based sorting algorithms that only draw triangles that are visible to the viewer, and not use the ordering provided in the mesh definition.
Terms can get easily confused in 3D computer graphics, since words like "texture", "material", and "surface" may appear to be interchangeable, but are not. Their differences have very different implications: a texture, or image, is simply a flat 2D grid made of pixels. A material is the combination of a texture and several properties: reflectivity, transparency, ambient color, etc. The majority of professional 3D applications use materials, since realistic models need to react differently to lights, based on what the object is made out of. Note that a material may sometimes be a combination of several textures and properties, such as the regular texture and a "bump-map texture", which shows surface relief based on the angles of light. Finally, a surface is strictly the geometry primitive that defines opaque elements of a model in 3D space, which are generally triangles. Generally a single model, made up of many surfaces, has a single material applied to it, though complex models may require different materials on different surfaces. Finally, mesh, model, and geometry is just the combination of points and triangles.
Painter's Algorithm
Before continuing, it is critically important that you understand that the layering of what is seen on-screen is only (for now) defined by the order in which we draw things: what is drawn first will always be drawn over by the next render commands. Thus, if we draw the back of an object first, then the front part of the object, it will appear solid. This is because the front-most layer will cover the back-most layer. Otherwise, the output would look severely distorted, just like what you had seen in the previous example.
The painter's algorithm is fast and efficient, only limited by how fast you can sort a list, but it is not very accurate with intersecting faces. The algorithm steps through each triangle in the scene and calculates the distance from the camera. This calculation can be done in several different ways, but it is generally better to average the distance between the three points of the surface triangle. Once you have a list of these distances, you must sort from furthest to closest, and render this sorted list. Why? Just like when painting a picture, you must paint the furthest objects first so that new and closer objects are drawn on-top of objects in the background.
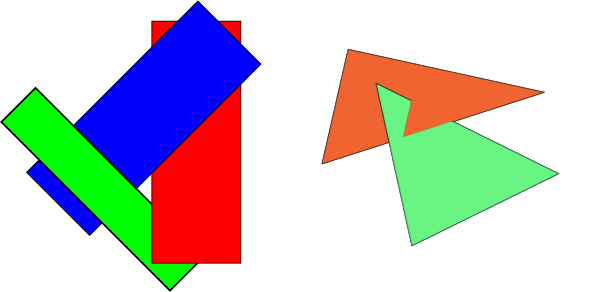
This simple overlay of polygons causes the painter's algorithm to fail, since no polygon can be drawn first, but in the general case this approach is fast and simple enough to understand for our current lesson.
A classic problem in computer science is sorting data: in our case, we only need to sort based on distance, which is a single floating-point value. Wikipedia, as always, has a great article on the problem of sorting algorithms which is well worth a read, but in our case, to keep code as simple as possible, we will be using "bubble-sort". We choose not to use the built-in sorting functions of JavaScript to make all steps in this lesson as clear as possible, since sorting is done on two parallel arrays.
Note
Big-O notation is a measure of computational complexity of a given algorithm. It is a formal system of representing and comparing how fast or slow an algorithm performs with a given size of input data. As an example, the sorting algorithm "bubble sort" has an average-case Big-O function of O(n2), which means that in the average case with n-given number of elements to sort, the total time taken will grow by a power of two for more data size. As an example, sorting a list of 10 elements may take 1 second, but 100 elements takes 100 seconds, and 1,000 elements takes 10,000 seconds! Big-O can be used to define other algorithm complexity behaviors, such as min/max complexity bounds. Note that these measurements are about growth-of-computational effort, not of processor-specific implementation details, since Big-O is a measurement of the algorithm, and not code. Implementation specific details can be measured, but through a different Big-O function type, and generally can only be measured by comparing two or more implementations. Big-O is a very large topic of study within the field of computer science, but all programmers should be comfortable with algorithm analysis.
Let us dive into the lesson's code: we start from the previous code-base, where the previous triangle-surface rendering block has been removed and replaced. Make sure to keep the vertex projection code, and pay attention to the source code comments, since the change in code is large.
// Painter's algorithm
// 1. Find the average depth of each face
// 2. Sort all faces based on average depths
// 3. Draw the furthest surfaces away

// 1. Calculate the average depth of each face
var AverageFaceDepth = new Array();
for(var i = 0; i < CubeFaces.length; i++)
{
    // Sum and average
    AverageFaceDepth[i] = DepthList[CubeFaces[i].a];
    AverageFaceDepth[i] += DepthList[CubeFaces[i].b];
    AverageFaceDepth[i] += DepthList[CubeFaces[i].c];
    AverageFaceDepth[i] /= 3;
}

// 2. Sort all faces by average face depth
// For clearity: AverageFaceDepth is our comparison variable,
// but CubeFaces is our list we are changing
// We are going to implement a bubble sort algorithm
// This is very slow but is a nice proof of concept
var IsSorted = false;
while(!IsSorted)
{
    // Default us back to a sorted state
    IsSorted = true;

    // Make sure each element[n] is < element[n+1]
    for(var i = 0; i < AverageFaceDepth.length - 1; i++)
    {
        // Is element[n] < element[n+1]?
        // This checks the opposite case: when things are inverted
        if(AverageFaceDepth[i] > AverageFaceDepth[i+1])
        {
            // Not sorted
            IsSorted = false;

            // Flip elements (both face depth and )
            var temp = AverageFaceDepth[i];
            AverageFaceDepth[i] = AverageFaceDepth[i+1];
            AverageFaceDepth[i+1] = temp;

            var temp = CubeFaces[i];
            CubeFaces[i] = CubeFaces[i+1];
            CubeFaces[i+1] = temp;

            // Break out of for loop
            break;
        }
    }
}

// Reverse array
CubeFaces.reverse();

// 3. Render the cube-face list, which is now ordered by furthest to closest
for(var i = 0; i < CubeFaces.length; i++)
{
    // Find the four points we are working on
    var PointA = PointList[CubeFaces[i].a];
    var PointB = PointList[CubeFaces[i].b];
    var PointC = PointList[CubeFaces[i].c];
    var Color = {R:(CubeFaces[i].i * 50) % 255, G:(CubeFaces[i].i * 128) % 255, B:(CubeFaces[i].i * 200) % 255};

    // Render the face by looking up our vertex list
    RenderFillTriangle(PointA.x, PointA.y, PointB.x, PointB.y, PointC.x, PointC.y, 2, Color);
    RenderTriangle(PointA.x, PointA.y, PointB.x, PointB.y, PointC.x, PointC.y, 1);
}
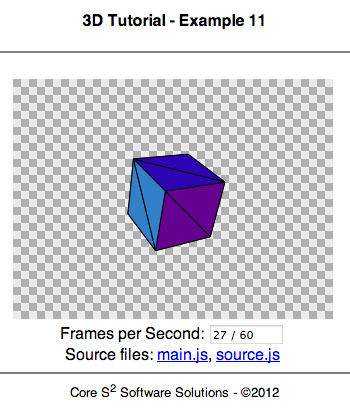
What you should see on your screen! Note that the cube should be rotating.
You'll notice that there are still some failures here: this is because the average distance between shared points for a polygon is just that: an average. There are special cases that will cause the painter's algorithm to fail: in the previous image, you will see that no single polygon should be drawn first, because unless there is per-pixel collision testing occurring, then entire segments of the model will be hidden.
checkpoint
Z-Buffer
Z-Buffer, or pixel-depth testing, is a pixel-specific depth test of the scene. Though accurate for realistic scene generations, it is often too slow to attempt in a software rasterizer. This simply means that it is best left to specialized hardware, such as dedicated graphics card, where Z-buffering is the De facto standard for hardware accelerated applications. The approach for Z-buffering is simple: for each pixel, find the closest object this pixel can "see" or draw. Once this is done, save that distance (depth) and which surface we found with. We can represent distance as a value between 0 and the maximum depth-size, generally the same byte-size as the color-buffer (32-bits). A way of visualizing this data is by rendering the depth buffer into a gray-scale image, where objects are whiter the closer they are, and darker the further they are. Once this Z-buffer is filled, the true rasterization can take place, where the pixel's paired collision data is retrieved and the appropriate color generated.
The color buffer on the left, with the depth buffer, using a gray-scale scheme, on the right. Suzanne makes a reappearance!
A clearer example of how Z-buffers are implemented is by walking through a render cycle for a hardware-based rendering system: first, all world geometry is transformed from the 3D scene-space to the 2D screen-space. Before drawing onto the image that is shown to viewers, the renderer first draws all polygons onto the depth buffer based on the computed pixel depth. This means that when drawing a triangle from an object, the triangle's fill color is the per-pixel distance from the scene's camera. Thus, we are rendering gray-scale triangles, where the color relates to a distance. When attempting to set a pixel's color, it first checks if the new color is lighter (closer) than the current color, and if so, it gets overwritten. Only closer objects overwrite existing pixel data, per pixel and not per surface. When a newly drawn pixel is placed into the depth buffer, not only is the depth saved, but the associated source triangle is also saved. Finally, once the full z-buffer is computed, the real rendering starts: the color buffer is filled, where every depth pixel is checked first, and the related material is retrieved and the correct color is drawn.
Triangle Filling
Before moving on to triangle texturing, we need to re-implement our generic triangle-filling function to gain control over per-pixel coloring. This re-implementation should give us the ability to set each pixel of a triangle to any color we want, where we currently can only select one color for the entire surface. It is critically important for you to understand that this part of the tutorial will introduce code that runs abnormally slow: this is because our original generic "draw filled triangle" function in "main.js" uses the fast built-in polygon filling features provided by the HTML5 Canvas (which, depending on your browser's implementation, may actually run as hardware-accelerated rendering commands), while we are now going to have to use the slower per-pixel drawing routines.
There are several approaches to triangle-filling algorithms: flood-fill and scan-line fill are the easiest to implement. There is a great article online here which has some well defined and faster approaches, but in our case we will be using the scan-line fill. This approach will find the top of the triangle, and iterate through each horizontal line (row) until we reach the bottom-most point of our triangle. Since triangles are guaranteed to be convex, we are thus guaranteed not to have to worry about filling the same horizontal line with more than one segment for the same triangle, thus speeding up our fill process!
Note
Want to quickly fill a complex polygon? If we were to take a polygon and fill it using our scan-line approach, we would have to worry about multiple-segments on a single horizontal line because the polygon could easily be concave. Not only that, but point-inclusion checking grows more complex, since some lines would define a given pixel as "to be filled", yet another group could define the opposite: thus, your code will have to do more line-collision detection. Instead, consider the definition of a polygon: we can always represent it as a series of triangle sub-divisions: this little property gives us a huge advantage! Tessellation is the process of taking a polygon and breaking it down to simpler geometry: this can be done both quickly, and only needs to be done once. So as long as the geometry does not change to add more edges or have an edge re-intersect, you can keep using the same data. Once tessellation is done, all you have to do is run our per-triangle filling algorithm, and you now have complex polygon filling as a feature!
Our triangle-fill algorithm is as follows: we will iterate for each line, from the top-most point of the triangle to the bottom-most point. This allows us to only work in the triangle's area, and not iterate through the entire screen-space. Each edge, which is the line between two of the triangle's vertices, as an "inside" and "outside" edge: the inside edge is the edge facing into the volume of the triangle, while the outside edge faces the outside of the triangle. It's relatively quick to check, given a pixel for which side we are on, since we can take the two vertices forming the edge in question and look at the third vertex, have that vertex form a line with the same slope, and then do a quick inclusion check on that horizontal edge.
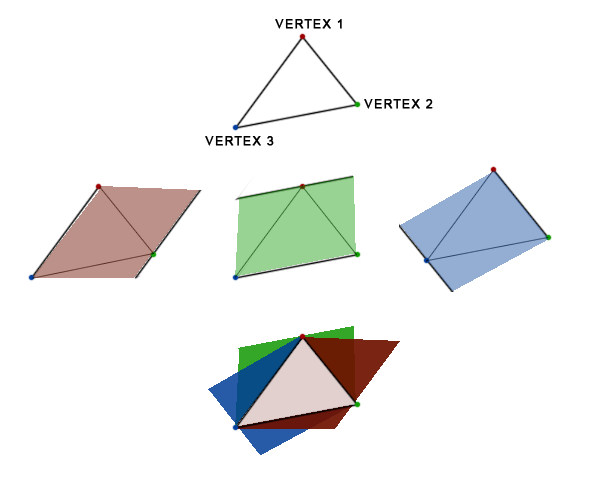
Triangle fill algorithm; observe how the first triangle is decomposed into three different volumes, and one re-composed forms the triangle volume to fill.
The following code is our approach, with some of the computation overhead (line ordering, slope calculation, etc.) all done before the actual scan-line iteration. It is important that you understand ordering, where we sort the vertex array based on their y-position, from top to bottom on-screen. This is done to simplify the code and keep it consistent: the given positions may be in an "upside-down" configuration where y1 is below y2, since the geometry rotations leads to this problem. Without this consistency check, we cannot define what is the "inside" and "outside" of a triangle volume.
// Our custom triangle filler function
function CustomFillTriangle(x1, y1, x2, y2, x3, y3, width, color)
{
    // Create an array of our vertices (as tuples) for easier access
    var Vertices = new Array({x:x1, y:y1}, {x:x2, y:y2}, {x:x3, y:y3});

    // Sort such that (x1, y1) is always the top most point (in height), then (x2, y2), and then (x3, y3)
    Vertices.sort(function(a,b) { return a.y - b.y; });

    // Define our edges: 1 to 2, 1 to 3, 2 to 3
    // Order is important here so that we maintain that the first point in our edge
    // is *always* higher (i.e. closer towards 0)
    var Edges = [{a:1, b:2}, {a:1, b:3}, {a:2, b:3}];

    // Find the top and bottom most point
    // Note: since y grows positive top-to-bottom, we want the smallest value here
    // Note: opposite logical implication for obtaining bottom position
    // Final note: the data is already pre-sorted! Look a the first (topmost) and last (bottommost) vertices
    var TopY = Vertices[0].y;
    var BottomY = Vertices[2].y;

    // Pre-compute the slops and intersections of each edge, so that we can use this data as a look-up
    // during the horizontal scan
    var Slopes = new Array();
    var Intercepts = new Array();
    for(var i = 0; i < 3; i++)
    {
        // Find the edge vertices (-1 because our arrays start at 0)
        var a = Edges[i].a - 1;
        var b = Edges[i].b - 1;

        // Compute slope & edge
        Slopes[i] = (Vertices[b].y - Vertices[a].y) / (Vertices[b].x - Vertices[a].x); // dy / dx
        Intercepts[i] = Vertices[a].y - Slopes[i] * Vertices[a].x;
    }

    // For each horizontal line..
    for(var y = TopY; y <= BottomY; y++)
    {
        // Find our min x and max x (default to out of bounds to begin with)
        var MinX = CanvasWidth + 1;
        var MaxX = -1;

        // For each edge
        for(var i = 0; i < 3; i++)
        {
            // Find the edge vertices (-1 because our arrays start at 0)
            var a = Edges[i].a - 1;
            var b = Edges[i].b - 1;

            // If we are in the range of this line, find the min/max
            if(y >= Vertices[a].y && y <= Vertices[b].y)
            {
                // Compute the horizontal intersection
                var x = (y - Intercepts[i]) / Slopes[i];

                // Save if new min or max values
                MinX = Math.min(MinX, x);
                MaxX = Math.max(MaxX, x);
            }
        }

        // Fill each pixel, using a line, for the given color
        // Note: we fill 2 pixels wide because of an odd behavior of line-edges being anti-aliased
        // which make the lines look transparent: switch to an edge of 1 to interesting behavior!
        RenderLine(MinX, y, MaxX, y, 2, color);
    }

    // Done rendering triangle
}
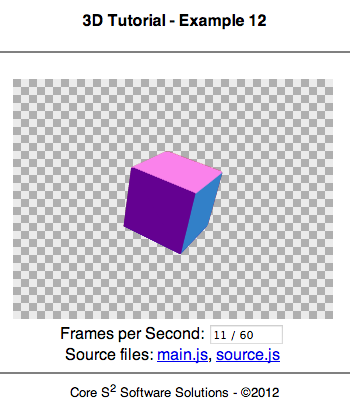
What you should see on your screen! Note that the cube should be rotating.
checkpoint
As mentioned above, you'll notice that doing this custom filling code has big a performance degradation. If you have a modern browser and modern computer, you may see around 30% to 50% of your previous FPS, but don't worry: this part of the code is purely an academic demo, and the "correct" method of doing this all would be through hardware acceleration, which isn't our goal here.
Before moving on to triangle texturing, we need to control the per-pixel coloring of each triangle: you'll notice in the code above that we use "RenderLine(...)" from "main.js" to fill the horizontal line, but we need more pixel-specific color control, so that we can read texture data and choose the correct color output. We will also directly call Canvas drawing functions to batch our per-pixel access and get a bit more of a speed boost, though in the end because we will again lose speed because we are doing many more drawing calls. This is very system specific, so in our case some of the code-concepts you are about to see below may be significantly different from other graphic libraries. You won't see any visual difference from our previous demo, but rendering speeds again will decrease.
// Our custom triangle filler function
function CustomFillTriangle(x1, y1, x2, y2, x3, y3, width, color)
{
    /*** Pre-Computation ***/

    // Create an array of our vertices (as tuples) for easier access
    var Vertices = new Array({x:x1, y:y1}, {x:x2, y:y2}, {x:x3, y:y3});

    // Sort such that (x1, y1) is always the top most point (in height), then (x2, y2), and then (x3, y3)
    Vertices.sort(function(a,b) { return a.y - b.y; });

    // Define our edges: 1 to 2, 1 to 3, 2 to 3
    // Order is important here so that we maintain that the first point in our edge
    // is *always* higher (i.e. closer towards 0)
    var Edges = [{a:1, b:2}, {a:1, b:3}, {a:2, b:3}];

    // Find the top and bottom most point
    // Note: since y grows positive top-to-bottom, we want the smallest value here
    // Note: opposite logical implication for obtaining bottom position
    // Final note: the data is already pre-sorted! Look a the first (topmost) and last (bottommost) vertices
    var TopY = Vertices[0].y;
    var BottomY = Vertices[2].y;

    // Pre-compute the slops and intersections of each edge, so that we can use this data as a look-up
    // during the horizontal scan
    var Slopes = new Array();
    var Intercepts = new Array();
    for(var i = 0; i < 3; i++)
    {
        // Find the edge vertices (-1 because our arrays start at 0)
        var a = Edges[i].a - 1;
        var b = Edges[i].b - 1;

        // Compute slope & edge
        Slopes[i] = (Vertices[b].y - Vertices[a].y) / (Vertices[b].x - Vertices[a].x); // dy / dx
        Intercepts[i] = Vertices[a].y - Slopes[i] * Vertices[a].x;
    }

    /*** Canvas Overhead ***/

    // Shortext context handle
    var ctx = BackContextHandle;

    // Save context
    ctx.save();

    // Set width and cap style
    ctx.lineWidth = width;
    ctx.lineCap = "butt";
    ctx.lineJoin = "round";

    // Set color
    if(color != undefined)
        ctx.fillStyle = "rgb(" + color.R + "," + color.G + "," + color.B + ")";
    else
        ctx.fillStyle = "rgb(0, 0, 0)";

    /*** Scan-Line Filling ***/

    // For each horizontal line..
    for(var y = TopY; y <= BottomY; y++)
    {
        // Find our min x and max x (default to out of bounds to begin with)
        var MinX = CanvasWidth + 1;
        var MaxX = -1;

        // For each edge
        for(var i = 0; i < 3; i++)
        {
            // Find the edge vertices (-1 because our arrays start at 0)
            var a = Edges[i].a - 1;
            var b = Edges[i].b - 1;

            // If we are in the range of this line, find the min/max
            if(y >= Vertices[a].y && y <= Vertices[b].y)
            {
                // Compute the horizontal intersection
                var x = (y - Intercepts[i]) / Slopes[i];

                // Save if new min or max values
                MinX = Math.min(MinX, x);
                MaxX = Math.max(MaxX, x);
            }
        }

        // Fill each pixel, using a line, for the given color
        for(var x = MinX; x <= MaxX; x++)
            ctx.fillRect(x - width/2, y - width/2, width, width);
    }

    // Revert context
    ctx.restore();

    // Done rendering triangle
}
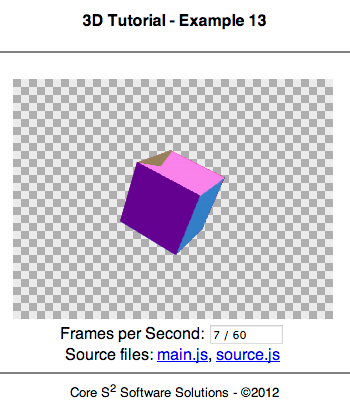
What you should see on your screen! Note that the cube should be rotating. You may see visual artifacts due to the failure of the painter's algorithm; we resolve this in lesson 19.
checkpoint
Triangle Texturing
Texturing a surface is one of the most important steps to take in a rasterization framework, though it can be overwhelmingly complex because of the math involved. The goal here is to develop an image-to-triangle projection function, much like the 3D to 2D function we developed, so that when we want to color a triangle on-screen, we can look at the assigned texture and figure out what pixel color we should be using.
First, we have to define how 3D models relate to 2D textures, since this behavior is different than projections of 3D points to 2D pixels. First, we let each 3D vertex on our model have a position in the 2D texture-space. We let these coordinates, out of a common convention, be referred to as UV-variables and the texture space is named UV-space. We use the variable-pair UV simply because they are the two previous letters in the alphabet to the commonly-used XYZ point/vertex convention. These variables will be normalized floating-point values that map to a texture using the cartesian coordinate system where, much like our Canvas coordinate system, defines its origin as (0,0) in the top-left, and the maximum value as (1,1) in the bottom right. U, which maps to the texture variable X, grows positive to the right of the image. V, which maps to the texture variable Y, grows positive to the bottom of the image. UV coordinates are always normalized for the sake of consistency and to help with texture pixel-source computation: this means that UV values always range from 0 to 1, inclusive. This allows us to let UV (0.5, 0.5) always be the center of the image, regardless of how big, small, wide, or thin the source image is. By letting each triangle's vertex be associated with a UV point, we can fill the rest of the triangle by interpolation!
An example of how texture mapping works, as well as how the UV-coordinate system works.
Let's try to map our cube to a simple texture we have have. We'll have to first define how our cube will maps to the texture, using the above-described UV-coordinate system, then in JavaScript load our source texture, and finally implement our new pixel-texture mapper function. Our "test" image will be a 128 by 128 pixel image that has two empty, but colored, squares of 64 x 64 pixels each, and another two pair of squares that have Reddit's "coat-of-arms" and the Reddit alien itself. Our texture is particularly small to help with performance issues. Modern graphics hardware can load massive images and other texture resources.

When does the narwhal bacon? Midnight.
First, we have to load the texture itself. To do this, we will have to instantiate a new canvas object, and copy an HTML image tag's image data into said canvas. We are going to do all of this in the "Init()" function, then save three important variables globally: TextureWidth and TextureHeight are the texture's respective sizes for each dimension, and finally TextureBuffer is a flat-array of the image's data: this array contains all of our pixel data, stored one row after another, where each pixel has four color channels (red, green, blue, and alpha / transparency), with each channel consuming only a byte of memory as an integer (ranging from 0 to 255). We will have to iterate through this array to access the original image data, where the following simple index system can used:
Flat-array index = Image Positiony x Image width x 4 + Positionx x 4 + Channel Offset
To access a given pixel (Image Positionx, Image Positiony) on an image (of size Image Width x Image height), with 4 channels of color, we use the above equation. This works because a flat array is simply where each row of an image is appended, and since the y position is the number of rows we skip, we simply multiply y by the width, and add the x offset.
In the initialization function, there is a bit of a "hack" to help make sure the texture can load regardless of the browser's security settings. Browsers typically prevent loading content outside of the domain the rendered document comes from, which if non-existant is a common attack vector hackers may use for Phishing schemes. This security rule is called "Same Origin Policy", and though good for users, it prevents us from loading the image file directly into this demo code. To resolve this, we will embed the image itself, as a Base64-encoded string, pasted as text into the source-code of the project:
// Global texture array (one big TextureWidth * TextureHeight * sizeof(rgba) array)
var TextureWidth = 0;
var TextureHeight = 0;
var TextureBuffer;

/*** Functions ***/

function Init()
{
    // Create a second canvas buffer to load our image into
    TextureHandle = document.createElement("canvas");
    var img = new Image();
    img.onload = function() {
        TextureHandle.width = img.width;
        TextureHandle.height = img.height;
        var TextureContext = TextureHandle.getContext('2d');
        TextureContext.drawImage(img, 0, 0, img.width, img.height);

        // Save actual texture info
        TextureWidth = img.width;
        TextureHeight = img.height;
        TextureBuffer = TextureContext.getImageData(0, 0, img.width,img.height);
    }

    // This little hack is to get around the security issue with loading local resources
    img.src = 'data:image/png;base64,iVBORw0KGgoAAAANSUhEUgAAAIAAAACACAIAAAE7W8YKAAAACXBIWXMAABE6AAAROgG2YLIrAAAKT2lDQ1BQaG90b3Nob3AgSUNDIHByb2ZpbGUAAHjanVNnVFPpFj333vRCS4iAlEtvUhUIIFJCi4AUkSYqIQkQSoghodkVUcERRUUEG8igiAOOjoCMFVEsDIoK2AfkIaKOg6OIisr74Xuja9a89+bN/rXXPues852zzwfACAyWSDNRNYAMqUIeEeCDx8TG4eQuQIEKJHAAEAizZCFz/SMBAPh+PDwrIsAHvgABeNMLCADATZvAMByH/w/qQplcAYCEAcB0kThLCIAUAEB6jkKmAEBGAYCdmCZTAKAEAGDLY2LjAFAtAGAnf+bTAICd+Jl7AQBblCEVAaCRACATZYhEAGg7AKzPVopFAFgwABRmS8Q5ANgtADBJV2ZIALC3AMDOEAuyAAgMADBRiIUpAAR7AGDIIyN4AISZABRG8lc88SuuEOcqAAB4mbI8uSQ5RYFbCC1xB1dXLh4ozkkXKxQ2YQJhmkAuwnmZGTKBNA/g88wAAKCRFRHgg/P9eM4Ors7ONo62Dl8t6r8G/yJiYuP+5c+rcEAAAOF0ftH+LC+zGoA7BoBt/qIl7gRoXgugdfeLZrIPQLUAoOnaV/Nw+H48PEWhkLnZ2eXk5NhKxEJbYcpXff5nwl/AV/1s+X48/Pf14L7iJIEyXYFHBPjgwsz0TKUcz5IJhGLc5o9H/LcL//wd0yLESWK5WCoU41EScY5EmozzMqUiiUKSKcUl0v9k4t8s+wM+3zUAsGo+AXuRLahdYwP2SycQWHTA4vcAAPK7b8HUKAgDgGiD4c93/+8//UegJQCAZkmScQAAXkQkLlTKsz/HCAAARKCBKrBBG/TBGCzABhzBBdzBC/xgNoRCJMTCQhBCCmSAHHJgKayCQiiGzbAdKmAv1EAdNMBRaIaTcA4uwlW4Dj1wD/phCJ7BKLyBCQRByAgTYSHaiAFiilgjjggXmYX4IcFIBBKLJCDJiBRRIkuRNUgxUopUIFVIHfI9cgI5h1xGupE7yAAygvyGvEcxlIGyUT3UDLVDuag3GoRGogvQZHQxmo8WoJvQcrQaPYw2oefQq2gP2o8+Q8cwwOgYBzPEbDAuxsNCsTgsCZNjy7EirAyrxhqwVqwDu4n1Y8+xdwQSgUXACTYEd0IgYR5BSFhMWE7YSKggHCQ0EdoJNwkDhFHCJyKTqEu0JroR+cQYYjIxh1hILCPWEo8TLxB7iEPENyQSiUMyJ7mQAkmxpFTSEtJG0m5SI+ksqZs0SBojk8naZGuyBzmULCAryIXkneTD5DPkG+Qh8lsKnWJAcaT4U+IoUspqShnlEOU05QZlmDJBVaOaUt2ooVQRNY9aQq2htlKvUYeoEzR1mjnNgxZJS6WtopXTGmgXaPdpr+h0uhHdlR5Ol9BX0svpR+iX6AP0dwwNhhWDx4hnKBmbGAcYZxl3GK+YTKYZ04sZx1QwNzHrmOeZD5lvVVgqtip8FZHKCpVKlSaVGyovVKmqpqreqgtV81XLVI+pXlN9rkZVM1PjqQnUlqtVqp1Q61MbU2epO6iHqmeob1Q/pH5Z/YkGWcNMw09DpFGgsV/jvMYgC2MZs3gsIWsNq4Z1gTXEJrHN2Xx2KruY/R27iz2qqaE5QzNKM1ezUvOUZj8H45hx+Jx0TgnnKKeX836K3hTvKeIpG6Y0TLkxZVxrqpaXllirSKtRq0frvTau7aedpr1Fu1n7gQ5Bx0onXCdHZ4/OBZ3nU9lT3acKpxZNPTr1ri6qa6UbobtEd79up+6Ynr5egJ5Mb6feeb3n+hx9L/1U/W36p/VHDFgGswwkBtsMzhg8xTVxbzwdL8fb8VFDXcNAQ6VhlWGX4YSRudE8o9VGjUYPjGnGXOMk423GbcajJgYmISZLTepN7ppSTbmmKaY7TDtMx83MzaLN1pk1mz0x1zLnm+eb15vft2BaeFostqi2uGVJsuRaplnutrxuhVo5WaVYVVpds0atna0l1rutu6cRp7lOk06rntZnw7Dxtsm2qbcZsOXYBtuutm22fWFnYhdnt8Wuw+6TvZN9un2N/T0HDYfZDqsdWh1+c7RyFDpWOt6azpzuP33F9JbpL2dYzxDP2DPjthPLKcRpnVOb00dnF2e5c4PziIuJS4LLLpc+Lpsbxt3IveRKdPVxXeF60vWdm7Obwu2o26/uNu5p7ofcn8w0nymeWTNz0MPIQ+BR5dE/C5+VMGvfrH5PQ0+BZ7XnIy9jL5FXrdewt6V3qvdh7xc+9j5yn+M+4zw33jLeWV/MN8C3yLfLT8Nvnl+F30N/I/9k/3r/0QCngCUBZwOJgUGBWwL7+Hp8Ib+OPzrbZfay2e1BjKC5QRVBj4KtguXBrSFoyOyQrSH355jOkc5pDoVQfujW0Adh5mGLw34MJ4WHhVeGP45wiFga0TGXNXfR3ENz30T6RJZE3ptnMU85ry1KNSo+qi5qPNo3ujS6P8YuZlnM1VidWElsSxw5LiquNm5svt/87fOH4p3iC+N7F5gvyF1weaHOwvSFpxapLhIsOpZATIhOOJTwQRAqqBaMJfITdyWOCnnCHcJnIi/RNtGI2ENcKh5O8kgqTXqS7JG8NXkkxTOlLOW5hCepkLxMDUzdmzqeFpp2IG0yPTq9MYOSkZBxQqohTZO2Z+pn5mZ2y6xlhbL+xW6Lty8elQfJa7OQrAVZLQq2QqboVFoo1yoHsmdlV2a/zYnKOZarnivN7cyzytuQN5zvn//tEsIS4ZK2pYZLVy0dWOa9rGo5sjxxedsK4xUFK4ZWBqw8uIq2Km3VT6vtV5eufr0mek1rgV7ByoLBtQFr6wtVCuWFfevc1+1dT1gvWd+1YfqGnRs+FYmKrhTbF5cVf9go3HjlG4dvyr+Z3JS0qavEuWTPZtJm6ebeLZ5bDpaql+aXDm4N2dq0Dd9WtO319kXbL5fNKNu7g7ZDuaO/PLi8ZafJzs07P1SkVPRU+lQ27tLdtWHX+G7R7ht7vPY07NXbW7z3/T7JvttVAVVN1WbVZftJ+7P3P66Jqun4lvttXa1ObXHtxwPSA/0HIw6217nU1R3SPVRSj9Yr60cOxx++/p3vdy0NNg1VjZzG4iNwRHnk6fcJ3/ceDTradox7rOEH0x92HWcdL2pCmvKaRptTmvtbYlu6T8w+0dbq3nr8R9sfD5w0PFl5SvNUyWna6YLTk2fyz4ydlZ19fi753GDborZ752PO32oPb++6EHTh0kX/i+c7vDvOXPK4dPKy2+UTV7hXmq86X23qdOo8/pPTT8e7nLuarrlca7nuer21e2b36RueN87d9L158Rb/1tWeOT3dvfN6b/fF9/XfFt1+cif9zsu72Xcn7q28T7xf9EDtQdlD3YfVP1v+3Njv3H9qwHeg89HcR/cGhYPP/pH1jw9DBY+Zj8uGDYbrnjg+OTniP3L96fynQ89kzyaeF/6i/suuFxYvfvjV69fO0ZjRoZfyl5O/bXyl/erA6xmv28bCxh6+yXgzMV70VvvtwXfcdx3vo98PT+R8IH8o/2j5sfVT0Kf7kxmTk/8EA5jz/GMzLdsAAAAgY0hSTQAAeiUAAICDAAD5/wAAgOkAAHUwAADqYAAAOpgAABdvkl/FRgAAHLpJREFUeNpi2b59OwM24CEmhlWcBc7y9PTcvn37////GRkZGXADFgYGBkFVKzZ2dgYGhuzuTXdZpqsx5nO9OOAxbx5ODWzs7IZJHOce/wiJL1RjLLi9c8K5xz8YXl3FqcFQhl35d+pdGfZ5k+r5+AUMUyecx++k809+3mWbrebBPbu3goGBgXEHwwUmJnwaXl7ZL3ha+MP7Cfb/JjD8YDj3+MfzS3v18YfS8mVLPIT/M5zazmDm+fLKfnyhJO4BNek8AwODaQIDA4M4VMqIQDwQCQhrgMTjhAkT8vPzidLwP4yBYeV/hnBGBmI0MDIy/v//n4GBgWHlfwibgAaoaiSdNPD0x48f+fn54VYBAAAA//9iIT8/kOCk9+/fa9gGMTAwGCZxMOz6v2HDBg4ODpwaOlaerwg3hPLEZRgcGTnKt+dN2HmrLRa7BmcbE3EdO0MZdgYGBsYlTxgYGMqcb+Bz0tL1e2qTXdU8ChkYGM49/sHAwMDJyuhgvBenhgk5juef/Ly1o3/Hjh3mchy//v0//+QnnnIAmoEYZT3/T8n9tWn6jh07CIQSJD+c+38Wko/FEVKU5YcLFy4YGBiQkB8QSYNg2v4fhsJlIZy2V/5H5tIgeZPsaQiAqGZgYAAAAAD//8KZH269/Kkmzk58PiHKCx4TPBl2/D//5CcDA0N2dyEzKzsDA8PVzV2s3mw7irYzkAWgFojrOObE+BoyMIgzMEByBtQf/yao+TLcYmZ49Ztb19AMfymN04LKWYd3L3Y9fnivuCsDJBsxMDBAqqLzDB0rGRjOhEx48ui+rqEZnnyLzwJ+fp7H7//8+/tXzaPwlsQWhrbtDFWeBxkq4EWj6UmG/yfiIEFHjg8qwg3vHN/EYOl3a0f/+Scd4UkVDAw+twolzs/7EZZcvmpu5/dff+Udc2aW+0wqcCczDnh5eZ31JJctW+YxwfPWjv+mIdVqXwoYUipu75zAwMCwY8eOj/eOMjD4kB/JDAwMy5YtY2Bg2FGwnWHHjuYUW3Edx5dX9sOLmxUz28lMRfD6GQNcFZfBKmVEk6xMEoBUbpRagKi4MQA/Pz/5lTNmRY9fltIgwvQHmgilFmD6o7+/n5qRXFhYOGHCBMx2EdUsgJgOMReZhCsAAAAA///MWE1o02AYfjLcjxBde5DC2FzpsAOZPxELCh6aOtuu05lbECeo5CLC1uGlB72YS/WydAdP9bYd4qkHSdMMXEtBhM11SPVQnexPsQx1eHEtpvGQrnazdZhmsO/0hSTvk+/9e543dfmg3mqIDyqLoqh0Ok2SZOM1UQMgEAhIkkSS5NHTnpWFF2YC2PpoAK9XfgJguRCQeJ8QjvmCBppoDUajOlsza4Xswtx6/jPtGwKQk8eBcad/bHJy8l74qQE6KwN0nLqoqiVZltV2xw3PSeDE+YHLONgHLwFFAzA8PEzdbrvSK9wd7DUCoKolqrNVzqKjqzvzDQCeTD1nuZCzKZjzESCCAApS6eGXohFOHhESYpTWL1guVLkhRsMAdE7OZ2d+lTQAg0OM+uqlwSAfcpybLl3rVr4DcPrHznS1za9u+l098uyirY9ubiIA9HjuGM+i4qdto6yuz+XZRV1SHyH7AXxQIvhfVTER9LW0NGfWCjRNOx/dxJZs2Va9fn9mrcByIUmSjJxgdV4ZERJiNCxGwywX0nMfgNfRpnzcDF73ClMKy4WMVUPZRfrLVGdrrihA02RZzmdn1ova2cPEXL8ls/WAcYDRyHRkFGJggH2j6T55MPFsRBjL/dBcLhefndn1H8guAJHRSwDaH8cxG0d+GcvveMdxnvfiAsHz8cokYkKzk78SOGC3Xb2lJw/uxxttdnV00VsA+1cX7QlAPdY0DUC3WIOTTfn2ahgzVUV5NN4j4fXHEEuUp2mWgKhpmuZ2u5PJpHkx2JrVK5tUKmXCCSp+YBgmFotVb0wOsm5U32xsbFgsFjPrYEdIrVarydp0h7m/xfa+bxV2u31paekf80ijANXWGYbZWxdV0ql6/SbX6kKaCsPwc9ziSC5voh9i0k3bTUQpERQV2Go7pyC66A8ENyS7MNQZFP0rZCVEaZOQssb0orCbMKjvmJlFBaJyxPQiViNKC2d/Zj9sZTtdfPNwOvvJrdxZ9F0c2AeD53nf93u/933eL7H+gOM4QRDod5r6iWn0sYw7UQ6aEZiosW++P3qno8NisagqCgmYpUP5wSPV1dWzdBhfh6QVt2khwJ3l+9zBvPujtP6l31wjOzAysaWgzKdrwFcwj9DS89lkc3pND1Hfs8dS4pvRIDiJZgR4nqdAAQh7yaGtlsgjuWS+HoA5w/ljxhdJugjg/X7e/Hg1uAqfroFpgzjZxyTXzP1B3eu6I5uZYRhCiJj9sG84SOVTlmWDwSAAWXP0dV4EsHBVwQve4M2oN4dKmXYQQmiXCuDk1d4jBStCoVAqCPAbN15o7aW/n775Jg4Fduw64AVkxF2+cZVcSpVbNnuu+RGAUrppzN1AOfcNB8+d2Jd0t5IwAZO13LI2b/xT2N59w8GWSzVMTp1J0c7Ki2rNkfs7d+u+f59gWbb3ZVA3Od9MQoNOMoQedA0sXWymZvYPdur1epPN2R7yLLz9Aa+fYcEiKidQw+flZMon++CewrYb18ShgJec8Q+u53leksKDgaS7rYQJuJy2slp3tiGrse5orpGFkRMEwT/QhsWAVYHAyiDDKUOn69T55lPnmwFIVjA83/syQNFv2llmMMxMUQhRDuX1HTt2HaDKB8dxH19xsDJMO2grHmdRh9DancoA8+fOXjnvbXFxcUrT6LlSC42fxsbGY/UtodAPuAMikJeTScsNURQP3TuMijqaZ+m/Ll+5Lg4FHnQQ2+btx043fHreM2n15dpcZEVFRTe7nwOSf7DT5XKVjhBp2xy4CwFwW8rgOI4nXQA4d2H4ytt7CUbWPy/TXFI0M8uQtWTdyMBdpHCpCbjdbvkOIoTcsgHXRsN5s/kdv2YZ6X7nFWrNXIVXqFU2loSQlF1eU62FCCG0doNCIXLYawRBcDltcjGXqN6dpuKEZgRiz81irVjztJhZ6n/0gPJtgnwbRp2j6dMTfWQ3PzY29m94ICp6ACpBRWMCqhpJiThSjNNYWIllY7WlZY3v1x3VQPTv6yrJqVVR0Ks4ROxERZ82Z6BF+v1OWqVRSZKampocDofSonHCPapWrbEH7Ha73W4H0N/fT59lVVZWVlVVhQsWh0N5FcR5SaFxCMUyrcfj8Xg8VKiP89BEYwLxkcVJnelCQE4s8nBBtfLz82Mln3QJIYqstbX1n/SAMvlEfYk0lTDTpwP6qGl0ikflJzvXHttUFcZ/p7ddKysoqAPC5loeI+JkjFcgPniuuxURJwMMoHY8NBMY3RgOJDAJGB4aqYtmijpKALPNkKIC7bbMF4kgsnaQxbAGabGAMALG8WrXx/GPs167jnbDaHsXOX/de9fbfb/zncf3fb/faXf5gZycHJPJJNzKZDKv19udF8XCD5hMJq1WW1NTMyc3t6q6upvWiyulNJvNGo3mz9ZWkVAbdwfAWHmg/tD+PXv2AEhKn/rbicNRRPaiA8DzPMdxuhefZ7ctTd8sWLCgpKRk/Pjx4gWg1WrZohCgVCJkpQC7UnIoLS296fEP6MUBUD82ctu2bSICwNiacapEq9VqO+9pCKnmChKyAcCo51a1+igh5NSpU62trX369BEFAGZ9Sl9pU4vv9i0PgCP15qemaRlzQYikOTcBi7e0q9M1ZNasWQcOHGC8TpwB9E+fMjpFUV9fv/7VnE07TYAPIWxAsOofSPvCbX/mrISTnfa+AwoDaUjjCymldXV1Dz36NGJIkHUAwCSeVpe74egRrcPMTA+NdSUSCROAAsArQ05ToI6m8YW4DQAajWZbxdfCV8Wa5GPDJnORwlbhXjo3SyqVHu8URQUCAYEpI3XtcxogAHW3XinaUJSZLG+80JZw+YwnaUisPcBYDFuFWyGD2WzmOA7AsTNXJwx9UMiMOI47ce4WAHvAgOlAHYWG2GtpGl/kOroPWGixWFIypjLrCww1MaBn2gEUvF/LiJmMQfLjPx0D4Pf7AcgVStt5DyOUbOc9zHoA4CT8icBZvhASvT3IO7Hm9lEJAYDeib2USuWNGzdi4oHgULG6PA+kTZg3e7lmqOf19CmR3kmjBRgTvA5ary+rr9y5eVSynFI0XvBMenLsos37Y8GRJSYmCjdjH5HXWc/tXDOzsrJy3p04VgTlw2Ete2y1oWBaZopCSMxfmvPMwZofYjGEpmpmqiflCfeaMSqry330ci1wFyR7bYNztm6V1eXu6/v9l0ttMd0Hhkx7LeAL/5fz7e/tHaq3BwxMah4ER9iAGadS+v0+NjeEXWLE/dcAqFQqhCgSYgGg+dB2gUhtvtxGKbVYLBsGYy/QwfqQ5pvqY8soAJrVvqTWmvYtW7IQyTx7Xly6I0YAzGZzgaEmQSZr83qH908I//vFMwAglcH3dwbzy+fU6m7vY1uF2woAeFCK4uLixydOb7nuB/DuxsJIs+g/2QfavF7m+sxkOc/zV7cCio40fUjzuO8wQq4EpBebmhpcHgkBIWTu4pKz3+5EbJj6Mn32vCVrKj/ZQghhAfND3wMwpHXF0Qstc5HC66UAJCGQD365P3YeKNNnv7h0LVsl+/WSUErz8/P/MBka0pcRqSzK+6NTFDQL68a9OdvlUcolrIgwd3FJbLbhDsFcmT67wFCjTJRfu+lJ4Hzl5eW2dQYAL7xS7PzmgwEZM3oPGGa37Gi80EYpHZ2iGKopqP5su9XltgG5wPAkWXOL9yvL928tzY5lXN0hnC7TZ//6k0Wbm4eblwYOHHjouENxn/ztxRP7rZ7BEktoyCiAibNY9wvKleYWL1NVxDgrCE9o+qdPsZ52AshYpJAkywkhNFsKi5flKzyAWmq2WHieJ4TQSXB4L6rVahZLW11ul7UmISEhngA4TuL3By43fVtbZOYBevs6Xh6MuUl0w0xcOwHdJmx4lgdQ8TKd8zAI1K8NZg5h3lj98RGmeokbgNy8N9j8YxE1FEom9tCtLTfOz0/jC+2Wg+vLqqtah4EdO5tOaBYsQbEH9fvinBMLq8eKFSuam5uFnOZHm31c7jq7ZYdubblxS37V4aN/q1XqYC4Kfz3+ZRWDwQAA0wm2HAZgn3IFyn74sMD4xAgc/Mi+fDh+NgMg9eJWq1iKzbgKAMhYCIAmjVz55jvt3Xy1vd7YY2qj7IBh1adbL56s5zhJzyvusohjflb6hMcGiai4e1d6oSr+H6hY/5d6oXsA4trCfkqm5ym2BFvVarXT6QwTnokdQCgn6XA4upSPi30OUEozMzMbGxsjMa09YBLbbDaxeyBsnESftfEHINjndDpVKlUkJVPolIgCKQ4AVq5caTAYCCGpqald9jGl1Gg0sgu9Xi8KDzDrO5i+cTJKvwv/XPChTqfrEOGLZwi1t86SxU4PwxRocQYQbkRqBs6dvPNHUzOEy1BFnchWoe2Nd4p7w3t68uTJIlpGu6mWC21MfnYvGv33pkGYEzrHPJ2Fr+LaiYXtKbq0NdLiI4ohFOWARvejCVGI/jpbKWATtWoxLM6J5KW8vLxdu3b14JzYaDT2bAD3qhL3AETfCqKM7y6l6xCDej0nJ0ev13c+50YIMRqNYt8HAJhMpkgrKTuj0gM2skjPu4wj4gxg9+7dUX74k91GSgNEAUCn0wn5bpTiilqtdjgckb7kL/auPiyqKo3/zszADLQEiCQqI34Am4vGxz6VGxstAsOMrTE+omKZYKZZ1jJguRr5AM+qtZs5Iyq7axRKDyVlC+ITM6KJmpbWowwJaYWJ8aHIGoMWzMDMnP3jDsOdDwZQsHWY96879557L7y/e973Pe857+/wRmKOKCUlZd++fXq9xYwls73BsL9rpOsT7ko3sHfvXr1en5SUpNPpOBwOj8crLy//1WcDR5cfnjd/vk6nu3/GAxUVFWFhYUKhsLKy8g5w9Yx2AL7+4draF5Yy61pUKpViyz8A1NXV1dXVcblcsVhsoDhceXCoCRUXANYikUjYP6VSaWlpaVJKanlJ0V9Xp9o2sI3funqop7v1VP8oNFNDBuDPcyQ3Z8O8YpdSWn7ivHDy1OomXc6WXTlbdlm1T0417f3AFqZyhefh3dOpOdOoW7xiHYBLRwvEWyVT66fk5+e7ALD/1dMEfPWj9gIw4V5uh9bIlNQIJ09lGkQJBXMXLM3duitKKPD19f306yvs27/75E1weZ4cEiiSmeKzmGWh4oxf/ttQ9PcX4+LiuG7/DOXILl1SiLdKipbsue8uD2+GGQAej0cTIPjMQxvInzx5cumJb23bmNde1lzRf1Nzhn3J2K2FxA1adMYDKjnTA7o0Vxt99mIMUD8VcXHTZq+qOfDWpQ55WTxJTU0dJebIPgDjbOpOsjNX3Pu3U9oNs6qbdKUnvo0SCrKysjZt2mTXnRJCeDyeXq83Q8JxF4RCtu664pk6ConHd6quxkeJMCoK+RTA05M8TpcaQUj43DXMHiZmkjq2LJo9My8vz/kBGGev6qf8wyKVSkUOAb2rjDdu3Lhx40YAEBF80AK/8abjsOj+lpW8IZQtJ4QmACIi/IwinmfyB79b1eefE6DKVBJCij/5fPoDFou8So6ca/iqwsPDw2kB4HA4E8LjrYrMwwLc3XmEqd0uLS2V5s+rtuQotKhPYR1btAF+vvZDy9hyPB+F/DMQEUIIfRB4OVZ//iJv+nymTX1l3vthGAMolUqJ5JFvW3UPh/ofqb1mfsjkB+f8Pug3FZ8ccEIATp8+XfyFZl9hrGW8CLP2AbC/PsZEMIGQlf2pbu6mlmMu3c3rLWPLASD/zKQ/PCnwloUkAkYF1Ed/mALcfwqKL0LFGZQan6qFsjcknT7ew2AwaPXG81dZZTutPbEJcwtfX+1UABBCir/QPJc632DoU1xkIL/1pp4QcrZRe11zc1VGzsXDO2mCteO1MtZnG7XUZsTL9/ILhWzpH/22h8V7C2eaglGODBx03Wj2uDCRvXNG2stveQdFlBW9ueXtEgBN7Qb2o7q0Oq9xwQuXZ374zlbnAeAluQrA7EcfZH/7eiMd58VjLMk9AveLh3cqlUpslQypJsyK1fbxtFccNI4SKqZ6YOeWNeNmxGq7dH8SzQUQ7O8Gm4LAgJmJzBIpZwBAIpHYErlGCU2jp9baKk9Pz3nzFyQnJ0skklMPAb4j9deom7vDl7sf4nKZokylUplTcGrxC6+O8+JaJPsK3kh5dt3W/d/lpTsFAJMeWcL88PXht2t0doOiw9U/AnCfJnq65jyAQ4bCIGgcPzqUI7M9efxwRUz8HHvfvuBso3Z2zGN+wbK13f5mB54jFte3dWu6jOxIgcfjmjqpc5igns4bfK+xAG7c7PN1Nc268Il8ALkvLlq1yhQmFp9d2afWSoqWerwqwe7vLR6ZFoLNSqSFWL0pJFVQ0IzHDmutzm97WLA7DLXXaLdOd/hoVZRQsOKgghmFcTgcBIqC/d0BtHfqegEgOwpKnCoKEkf6nWgBALYHNlJ09VAPN1JWVubn51dcXOzl5WV994Rg7P7evKUYWuqRFmK3avqlpdKJ3+DIT0gU8LWWxbt7WvBlB678duyRr5sBxEmkv3xexlwSiUR6AwVw7gq7xJx8evxLANQpkts8AAsXLnw/ZdmkWSmMdzWzFFxo7QZgMOL69evR0dEbNmywuNWsd7PGJwT3V7O+vagMwDrggfFu/SUwGPlUadK+WCwGwONajOY8BPwnlpjipe2ZEueJgsr2FppdsZluvTdCRX1b98mTJ9va2sgh/ByniOTJEjhpAOzuutZrqmV2T395yRGxx7rnl9AEiDmJjPaZjljTbOoxS55/7YN/b2aO73yB44gPxBizm76tklL6xFOy8mKFSZMEjBX29/c3LRVJUAyGAX9owudHLiWVKoBSFXCuRddtsKjGd3Pj9fTok59Za6w/sGPHDqfNBW1LFzGB6aJnBSUFbxw58dWsqBnVTQAg9OWNvYdLKd21axcOPcfuJVFCQeicV6jBDlEez80+fcB7u+QYM/3pZHHvWFl3fP0xqow526ibOdF9eoD7uZY+u7/gmbVcN/ftGWJKKZAIJxL72VCmN7TWVr28WBIsSg8PC83KXN7Yrm9s10cG8leuXPnQ42msJSUISZRRQw+TyOyJB49g9QXs/JFCRPCiAgA5BJoIGDGmCu16hIgzQGlcjEUUHxMTc7ZJx+Wgtlf1i1es7+68kb8+eUemBIMrnnESANhILFy4MOudtt7PVAvwCSGTJk169913jUYjIaSoqOj7g+9RMVBfjWkRByKJ2+vKuczmUr0Bq1KlUjFTOgYDOq4hZTypRJAh/qeH/ZmHyOXyiooKerOdePma3fJHhW81qw/CqWUAAAghx75pM/8UCDxUKpVSqSwoKIiLi2PSRBmbH83Y/LapKK1JF3hA28fFZhkUHalprm7pAXzxjon7BsC9KYJpJ2hCQoJSqVSdOMVur9d3j9BqorsGALHk8RDRS51d2ubj/2IrQq1Wm6xNIN/Obb1sSACYXUWYqIa9w0ifeFr3udbaKj6fX9d+T/RD4dMS/jJ6e8DVq1dBDaaAb30S45zpwUKI0urr6wHwLDI0+OjgqSx5CaNiZtLRVt12MNCjz77/0hE90WfDXqVOpwv21LXWVq2Zd/8T858s//j90QhAQECAVfdXKpUqo2n7GQBiy/YLEmctSJwVKs74z/ZMW733+xou2Ey9G/ZavHHKlClOrH3c5sIslUwJG5bjPFli08U6pt9Ep2T5+3hGp2Sxx03WxMhrRvWSxZFdXfza2tUB9/ndGU45FwDWwvDdMMmlk6qPgwPHuNR9RwHIkyW21lYVV9Y+JZrh0n6/AAx9v7GhSaZ49gj/C1GuHuASFwC/tphXofn4+LS3t7sAGBH95uTk2GXeACtRqNFohsQo4QJgsMLoNDs72xYbdrEts7FhbGxsVVWVC4BhNi/9AUMIWbasj9k9LS3NQf2zC4ChyeXLlzHQVMTtTFS4ALAjy5YtYxi7bH2ArQlyRUFDkNjY2KNHj5aVlSUlJTFnfH19zTwDQUFBDQ0NAAoLCx3bELZRamhoCAoKYo73798vlUqHhNOoAMCWw2dIHIGObQ4T9pjPs2sj1Gp1eHi4CwA7qh/G6WUfHx/macw+WVYw3AV0HXe4K/SrkUWsUMfTG4Uae87BB50dfT8tGe6kUimlNCIiwjUOsB8pOvrwF1kGmmwtOzhvu9U2oFarGbov/N9yoP66GNiXEmqBQX97Zg+u2WCYjlxhqD3lDlOzAcmjRykAOTk5t8D7eZs+3wVAn2RnZ2dnZzuwzmq1OjIyEkBqaqrVQMycY9izZw+A6upqZqt5u9/+kDAedSaIUnr58mW7moqIiDCfkclk27ZtY19NT0/fvXu3XWA0Go2vr++tRbej0QeY+cM7OjqY5CUz+mXzjykUCrus23YNvWMudRcA/Yq3t7dCoWD42RntS6XS/fv3O75LLpezKd1v06mMagDMhsj8OZeVlQ3eo+Tm5g48wnABMKD2bzmmys3NNeN3y/HVKAUgNjYWw5cRGpBG2gXA8MuAjKYuABxJVVUVIUQqlQ7e6FvJsWPHbm3o6wLAwm5EREQwtQ63YMTlcvnt+5JRbYLM/nOoNzKYZWRkZGRkuMLQ28XAbEYG3wkiIyOHy4G7nDBqamrMiZ3BYDB4anQXAIMdCgy+H1jp3Zy/c/mA4RmIUUqZKS3bSw7yd4QQxxz1LgAcWX8rYedEB9P+Ng3R/wYANaCEVyrnw2AAAAAASUVORK5CYII=';
}
Let's do a quick test, to make sure we can render the texture directly onto the image. We will be using a trivial texture-projection method as a test, called "flat-view texturing", where we simply take the on-screen position of the triangle's pixel data, and directly map it to the source texture. Thought not at all a way to texture a model, it's a great way to make sure your code is working right now:
// Fill each pixel, using a line, for the given color
for(var x = MinX; x <= MaxX; x++)
{
    // Get texture index
    if(TextureBuffer != undefined)
    {
        // Note: flooring (i.e. turning into an integer) is critically important!
        var i = (Math.floor(y) % TextureHeight) * TextureWidth * 4 + (Math.floor(x) % TextureWidth) * 4;
        // Perspective corrected:
        /*
        Ua = output; U and V are interchangable
        U0, U1 = Left texture and right texture limit
        Z0 Z1 = Depth of those points
        a = Where the pixel is, normalized from left to right

        Ua = ((1 - a) * (U0 / z0) + (a) * (u1 / z1)) / ((1 - a) * (1 / z0) + (a) * (1 / z1))
        */
        var R = TextureBuffer.data[i + 0];
        var G = TextureBuffer.data[i + 1];
        var B = TextureBuffer.data[i + 2];
        ctx.fillStyle = "rgb(" + R + "," + G + "," + B + ")";
        ctx.fillRect(x - width/2, y - width/2, width, width);
    }
}
What you should see on your screen!
checkpoint
Now that we have shown that we can load and render a texture (albeit very slowly), we need to map it to the given UV-coordinates from the 3D model to the 2D screen. To accomplish this, we will be using the perspective-correct texture-mapping function, to compute both for the U and V components of the output texture. When we draw a pixel on a triangle, we will have to explicitly use this function to compute the correct U and V screen-space coordinates, then look up what color is in that position on the texture, and finally draw out that color. After this section in the article, we will no longer use texturing, simply because of the computational complexity has become so big, it will be hard to test the rest of the code because of the performance degradation.
Before continuing, it's important to answer two big questions to get texturing working: how do we convert our screen-space (X,Y) coordinates, found on a triangle we are filling in, into UV-space coordinates to map the texture? Secondly, how do we find the corrected UV-space coordinates, since each triangle vertex has different UV-values? The classic approach, shown below using a mathematical formula from Wikipedia, is the perspective-correct (more on that later) texture-mapping function. Though somewhat easy to understand, implementing this function requires some complex overhead which makes it quite a challenge to code.
The perspective-correct UV texturing equation. From Wikipedia's Perspective correctness article. Note that alpha is the normalized-progress made during a scan-line, and the u0,1 represents the start and stop UV positions, and Z0,1 represents the respective depth at those points.
Instead, we choose to solve the problem of texture mapping using the barycentric coordinate system: a coordinate system relative to the vertices of a simple geometric object (in our case, a triangle). Though this coordinate system is not as intuitive as the classical 2D Cartesian-coordinate system, it gives us the ability to more easily compute UV coordinates based on screen-space and the vertices of the geometry in question! It is strongly recommended you read through the Wikipedia article on Barycentric coordinates, though we will try to clarify it here as much as possible. Like the Cartesian coordinate system, Barycentric coordinates have common points you can visualize to help you: each corner of a triangle is one of the 3-pair points (1, 0, 0), (0, 1, 0), or (0, 0, 1). The middle of these points (1/3, 1/3, 1/3) is the exact center of the shape (sometimes referred to as the "center of mass"). No matter how the triangle looks, how it is moved around, or how the points are manipulated, the center will always be (1/3, 1/3, 1/3). For clarification, one does not define a point on the triangle as a tuple- pair (such as (X,Y) used in Cartesian space), but must always use the 3-pair points. If any of the values of this 3-pair point are negative, then the point in question is on the outside of the surface of the triangle. The power of Barycentric-coordinates are that we can quickly find the weight (i.e. normalized distance from each corner), which in-turn can be used to interpolate a position based on different sets of weights on each point (i.e. what the UV-coordinate should be for a given triangle position and UV weights for each corner).
Sample Barycentric-coordinate positions on a normalized triangle. From Wikipedia's Perspective correctness article.
In our code, to texture-map the triangles of our cube, we will add some new lines into the per-pixel drawing event of our custom triangle rendering function. First, we will convert the 2D-screen space into the 2D-Barycentric coordinates; this is heavily documented in this Wikipedia article, and will not be covered here. From there, we then "apply" (i.e. multiply out) the UV source-pair from each corner to each respective weight / distance to the triangle's point in question, in which doing so will interpolate and find the correct texture-space source pixel color.
// For each horizontal line..
for(var y = TopY; y <= BottomY; y++)
{
    // Find our min x and max x (default to out of bounds to begin with)
    var MinX = CanvasWidth + 1;
    var MaxX = -1;

    // What are the two edges we are working between?
    var UsedEdges = new Array();

    // For each edge
    for(var i = 0; i < 3; i++)
    {
        // Find the edge vertices (-1 because our arrays start at 0)
        var a = Edges[i].a - 1;
        var b = Edges[i].b - 1;

        // If we are in the range of this line, find the min/max
        if(y >= Points[a].y && y <= Points[b].y)
        {
            // Compute the horizontal intersection
            var x = (y - Intercepts[i]) / Slopes[i];

            // Save this edge as one of the two we are drawing between
            UsedEdges[UsedEdges.length] = {a:a, b:b};

            // Save if new min or max values
            MinX = Math.min(MinX, x);
            MaxX = Math.max(MaxX, x);
        }
    }

    // Gather some important information for this horizontal scan


    // Fill each pixel, using a line, for the given color
    for(var x = MinX; x <= MaxX; x++)
    {
        // Get texture index
        if(TextureBuffer != undefined)
        {
            // Define local barycentric funcs!
            var f01 = function(x, y) {
                return (PointA.y - PointB.y) * x + (PointB.x - PointA.x) * y + PointA.x * PointB.y - PointB.x * PointA.y;
            }
            var f12 = function(x, y) {
                return (PointB.y - PointC.y) * x + (PointC.x - PointB.x) * y + PointB.x * PointC.y - PointC.x * PointB.y;
            }
            var f20 = function(x, y) {
                return (PointC.y - PointA.y) * x + (PointA.x - PointC.x) * y + PointC.x * PointA.y - PointA.x * PointC.y;
            }

            // New approach, just use on-screen barycentric positions (sans depth?)
            var alpha = f12(x,y) / f12(PointA.x, PointA.y);
            var beta = f20(x,y) / f20(PointB.x, PointB.y);
            var gamma = f01(x,y) / f01(PointC.x, PointC.y);

            var Tex1 = CubeUVs[IndexA];
            var Tex2 = CubeUVs[IndexB];
            var Tex3 = CubeUVs[IndexC];

            var tx = Tex1.u * alpha + Tex2.u * beta + Tex3.u * gamma;
            tx = Math.floor(tx * TextureWidth);

            var ty = Tex1.v * alpha + Tex2.v * beta + Tex3.v * gamma;
            ty = Math.floor(ty * TextureHeight);

            var i = (ty % TextureHeight) * TextureWidth * 4 + (tx % TextureWidth) * 4;
            /*
            // Render corner-colors
            var R = Math.floor(alpha * 255);//TextureBuffer.data[i + 0];
            var G = Math.floor(beta * 255);//TextureBuffer.data[i + 1];
            var B = Math.floor(gamma * 255);//TextureBuffer.data[i + 2];
            */
            var R = TextureBuffer.data[i + 0];
            var G = TextureBuffer.data[i + 1];
            var B = TextureBuffer.data[i + 2];
            ctx.fillStyle = "rgb(" + R + "," + G + "," + B + ")";
            ctx.fillRect(x - 1, y - 1, 2, 2);
        }
    }
}
What you should see on your screen!
checkpoint
For those with keen eyes, you'll notice that the texture is a bit warped. Why is that? Though the vertices are perspective-corrected (i.e. they shrink the further away they are), the textures are not: this is a mild issue with a quick fix: we must normalize the UV-coordinates again, and then divide them by distance, much like what we do with vertices! For this demo, I've replaced the original image with a checkers pattern to help see the distortions.
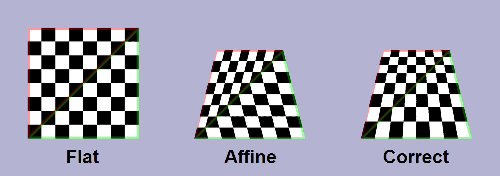
A series of example texture mappings, with the perspective distortion and correction shown. Taken from Wikipedia.
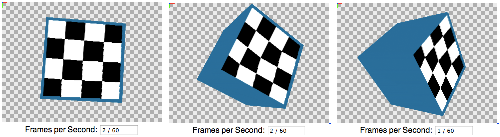
Our code's non-perspective correct distortion.
To correct this, as just mentioned, we will modify our Barycentric coordinates to be divided by distance so that it gives the appearance of smaller textures the further away the associated vertices are from us:
// New approach, just use on-screen barycentric positions (with depth!)
var alpha = f12(x,y) / f12(PointA.x, PointA.y);
var beta = f20(x,y) / f20(PointB.x, PointB.y);
var gamma = f01(x,y) / f01(PointC.x, PointC.y);

var Tex1 = CubeUVs[IndexA];
var Tex2 = CubeUVs[IndexB];
var Tex3 = CubeUVs[IndexC];

var w = ( 1 / VertexA.z ) * alpha + ( 1 / VertexB.z ) * beta + ( 1 / VertexC.z ) * gamma;

// Perspective corrected:
var tx = (Tex1.u / VertexA.z) * alpha + (Tex2.u / VertexB.z) * beta + (Tex3.u / VertexC.z) * gamma;
tx = Math.floor((tx * TextureWidth) / w);

var ty = (Tex1.v / VertexA.z) * alpha + (Tex2.v / VertexB.z) * beta + (Tex3.v / VertexC.z) * gamma;
ty = Math.floor((ty * TextureHeight) / w);
What you should see on your screen!
checkpoint
You'll notice ever since we started working with textures, that our rendered results are "blocky", or are heavily pixelated. This comes from two issues: the first is that we have low-resolution image, which when grown to the size of the cube, produces stretched-out pixels. The second issue is that we do not implement texture filtering. The first issue can only be avoided by providing higher-resolution texture data, which comes at the cost of run-time performance. The second issue is a big topic of its own: Wikipedia has, as always, a great introduction to texture filtering. What we can do to remove the "blocky" aspect of our source images is to interpolate between source pixels (through a variety of methods)! This way, we don't see the jagged immediate differences between adjacent pixels, but instead see a smooth gradual change between texture subsets. Though we cannot realistically implement any of these filters through this demo because of performance degradation, modern hardware gives these features built-in, and tends to be very efficient.
Aliasing is also somewhat related to this filtering issue: it is a visual artifact which occurs when you attempt to sub-sample, or convert, a higher-resolution object (image, geometry, etc.) to a lower-resolution output. Though not within the scope of this article, it is something to be aware of. It's an artifact you will commonly see along the edges of models in more complex scenery.
A classic example of aliasing: a checker-board pattern produces visual artifacts unless the sub-sampling is corrected. Taken from Wikipedia.
Note
The proper term for "jadged"-ness and rough / boxy / chunky edges is "Jaggies".
Having UV-coordinates defined per model vertex leads to some benefits and problems: we consume much less memory since we only have to define the UV-coordinates per unique vertex, but if you want to have two triangles share a common edge, you will be forced to have them also share the common UV-coordinate, which leads to ugly texturing. We can resolve this by having us texture geometry based on face-definitions, and not based on vertex definitions. The change in code is trivial, giving us more flexibility:
// Cube vertex data
var CubeVertex =
[
    {x:-1, y:-1, z:1},
    {x:-1, y:1, z:1},
    {x:1, y:1, z:1},
    {x:1, y:-1, z:1},
    {x:-1, y:-1, z:-1},
    {x:-1, y:1, z:-1},
    {x:1, y:1, z:-1},
    {x:1, y:-1, z:-1},
];

// Define UV-texture coordinates
var CubeUVs =
[
    { a:{ u:0, v:0 }, b:{ u:0, v:1 }, c:{ u:1, v:1 } },
    { a:{ u:0, v:0 }, b:{ u:1, v:0 }, c:{ u:1, v:1 } },

    { a:{ u:0, v:0 }, b:{ u:0, v:1 }, c:{ u:1, v:1 } },
    { a:{ u:0, v:0 }, b:{ u:1, v:0 }, c:{ u:1, v:1 } },

    { a:{ u:0, v:0 }, b:{ u:0, v:1 }, c:{ u:1, v:1 } },
    { a:{ u:0, v:0 }, b:{ u:1, v:0 }, c:{ u:1, v:1 } },

    { a:{ u:0, v:0 }, b:{ u:0, v:1 }, c:{ u:1, v:1 } },
    { a:{ u:0, v:0 }, b:{ u:1, v:0 }, c:{ u:1, v:1 } },

    { a:{ u:0, v:0 }, b:{ u:0, v:1 }, c:{ u:1, v:1 } },
    { a:{ u:0, v:0 }, b:{ u:1, v:0 }, c:{ u:1, v:1 } },

    { a:{ u:0, v:0 }, b:{ u:0, v:1 }, c:{ u:1, v:1 } },
    { a:{ u:0, v:0 }, b:{ u:1, v:0 }, c:{ u:1, v:1 } },
];

// Cube face data
var CubeFaces =
[
    { a:0, b:1, c:2, i:1, f:0 },
    { a:2, b:3, c:0, i:1, f:1 },

    { a:1, b:5, c:6, i:2, f:2 },
    { a:6, b:2, c:1, i:2, f:3 },

    { a:5, b:4, c:7, i:3, f:4 },
    { a:7, b:6, c:5, i:3, f:5 },

    { a:4, b:0, c:3, i:4, f:6 },
    { a:3, b:7, c:4, i:4, f:7 },

    { a:3, b:2, c:6, i:5, f:8 },
    { a:6, b:7, c:3, i:5, f:9 },

    { a:0, b:1, c:5, i:6, f:10 },
    { a:5, b:4, c:0, i:6, f:11 },
];

// ... Previous code here ...

// Replace the cube-face for-loop that rendered triangles after sorting through distance:

// 3. Render the cube-face list, which is now ordered by furthest to closest
for(var i = 0; i < CubeFaces.length; i++)
{
	// Find the four points we are working on
	var PointA = PointList[CubeFaces[i].a];
	var PointB = PointList[CubeFaces[i].b];
	var PointC = PointList[CubeFaces[i].c];

	var VertexA = VertexList[CubeFaces[i].a];
	var VertexB = VertexList[CubeFaces[i].b];
	var VertexC = VertexList[CubeFaces[i].c];

	var UVA = CubeUVs[CubeFaces[i].f].a;
	var UVB = CubeUVs[CubeFaces[i].f].b;
	var UVC = CubeUVs[CubeFaces[i].f].c;

	// Render the face by looking up our vertex list
	CustomFillTriangle(PointA, PointB, PointC, VertexA, VertexB, VertexC, CubeFaces[i].a, CubeFaces[i].b, CubeFaces[i].c, UVA, UVB, UVC);
}
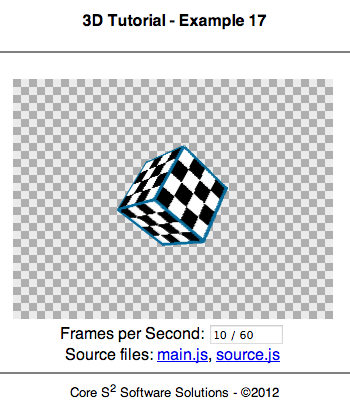
What you should see on your screen!
checkpoint
Lights & Shading
Lights
Shading, or the application of light in a scene changing the surface color, is a helpful effect used to generate realistic looking objects based on properties of lights and the object's geometry and texture. There are multiple approaches, each with pros and cons. In this section we will implement Gouraud shading, sometimes called "flat shading", since it works on each flat-surface within the scene and is easy to compute. Another common shading technique is Phong shading, where we compute the light interaction with each vertex and requires per-pixel interpolation.
Examples of flat and phong shading for a polygon-based sphere. Taken from Wikipedia.
Flat Shading
Flat shading is where we compute the angular-difference between incoming light (from a light source) and the surface normal. Surface normals are simply the direction at which the surface is facing towards. By using this angle, we can compute the intensity of the light being applied to the surface: if a surface faces directly towards a light, it will catch the full intensity of it, but the more angled away the surface normal is, the less it receives. There is a point at 90-degrees where light no longer affects the surface: this is because the surface is perpendicular to the light source and thus has no surface to absorbe incoming light. Surfaces facing more than 90-degrees away from a light source still receive no light since only the back of the object is receiving light, and thus occludes the surface in question.
Ambient Light
It is common to set an ambient light source in a 3D scene, such as the sun's light applied to an outdoor area. This feature can be implemented in multiple ways. If your scene has multiple light sources, compute each light-source and surface combination (seen below) and sum them to produce the final surface color. In the case of a global minimum light level, take all light-source and surface combinations and apply a minimun filter of the ambient color. As an example in this last case, if your ambient color is a dark red, and a surface in question comes out as black, we will replace the black with dark red because the RGB values of black are lower than the dark red. This should applied on each color channel independently, and not on the color as a whole.
To implement flat shading, we must first compute the surface normal, which is a vector that points directly out of a surface. Another definition would be that it is a line which runs perpendicular to a surface. Both of these definitions lead us to an issue: which "side" of a surface is the normal, since any given triangle has both a front and back? The solution is simple: we revert back to our "right-hand" definition we discussed in the section on 2D graphics: if a set of three points, when drawn in order, are drawn counter-clockwise, then the direction of your tumb, as your other four fingers curl around the three points, is the direction of the normal. Simply put, the direction of our normal is the direction where your thumb points to when curling around the three points.
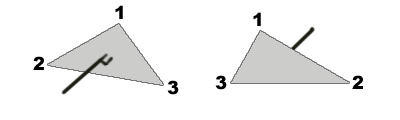
The left triangle has a surface normal coming towards the observer, while the right triangle's surface normal is going away from the observer.
Computing the surface normal, given three points which forms a surface, is not difficult. We will take advantage of a property of three-dimensional vectors: the easy application of the cross-product function! The cross-product simply takes two vectors, pointing from a common origin, "crosses" them, forming a third perpendicular vector. This function was created as a helpful tool in linear algebra, and is particularly helpful in our application since a cross-product can give us the surface normal from a triangle! The cross-product forumla is non-trivial, as it uses special properties of vectors, which is beyond this article's scope, but you are encouraged to investigate the subject-matter. What is important to know is that that the function involves multiplication and addition of components, and will result in a new vector.
Given a vector A and a vector B, in which they originate from the same point (i.e. have the same origin) and are normalized (have a length of 1), and their sub-components are indexed through the sub-scripted x, y, and z, the cross-product function is the following:

Note that the result will always be a vector, which in this case is named "Result", and that both vectors A and B are normalized, sharing the same origin. Link to original article from Wikipedia.
As a quick example, try the cross product of the X-vector <1, 0, 0> and the Y-vector <0, 1, 0>. If your math is correct, you will result in the Z-vector <0, 0, 1>. It is also important to note that the order of arguments are important. A-cross-B is not the same as B-cross-A. If you cross Y-vector with X-vector (i.e. the reverse order of what you first did), you will result in the negative Z-vector <0, 0, -1>.
The following is a genetic implementation of the above math equation that you can use in JavaScript. Remember that order of arguments are important.
function CrossProduct(A, B)
{
    var OutVector = {x:0, y:0, z:0};
    OutVector.x = (VectorA.y * VectorB.z - VectorA.z * VectorB.y);
    OutVector.y = (VectorA.z * VectorB.x - VectorA.x * VectorB.z);
    OutVector.z = (VectorA.x * VectorB.y - VectorA.y * VectorB.x);
    return OutVector;
}
In our case, we want to compute the surface normal, so that means computing the cross product of two vectors that are on the surface. Since a surface is defined by three points, we can immediately generate two surface vectors (vectors that run along the surface). From these two vectors, we will cross them (in the correct order), and finally generate the surface normal. First, assume our surface is a triangle, and that our triangle is defined as the three points A, B, and C. We can then compute two vectors with a common point, then normalize them, completing both prerequisites for applying the cross-product function. Let vector V1 be B - A, and let V2 be C - A. Then, to produce the normal, apply the cross-product of V1 into V2. Note that order here is importance, since we want to preserve the counter-clockwise right-hand rule.
In the following function, we take three given points, forming a surface-triangle, and return a surface normal.
function GetSurfaceNormal(VertexA, VertexB, VertexC)
{
	// Find the first vector and second vector
	var VectorAB = {x:VertexB.x - VertexA.x, y:VertexB.y - VertexA.y, z:VertexB.z - VertexA.z};
	var VectorAC = {x:VertexC.x - VertexA.x, y:VertexC.y - VertexA.y, z:VertexC.z - VertexA.z};

	// Normalize vectors
	var LengthAB = Math.sqrt(VectorAB.x * VectorAB.x + VectorAB.y * VectorAB.y + VectorAB.z * VectorAB.z);
	VectorAB = {x:VectorAB.x / LengthAB, y:VectorAB.y / LengthAB, z:VectorAB.z / LengthAB};

	var LengthAC = Math.sqrt(VectorAC.x * VectorAC.x + VectorAC.y * VectorAC.y + VectorAC.z * VectorAC.z);
	VectorAC = {x:VectorAC.x / LengthAC, y:VectorAC.y / LengthAC, z:VectorAC.z / LengthAC};

	// Return the computed cross product
	return CrossProduct(VectorAB, VectorAC);
}
Once we have a surface normal, we can determine the light intensity based on the angle difference between a light source and the normal. The idea is simple, as mentioned above: the greater the degree of difference, the less light applies to the surface, up to 90 degrees in which no light applies to the surface. A simple way of computing the angle between two vectors is computing the dot-product. This function allows one to determine the angular-distance between two normalized vectors.
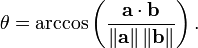
The dot-product function returns the angle between two normalized vectors, a and b. Note that this equation form does not need a or b to be normalized. Image taken from the Wikipedia dot-product article.
Simply, the function is the inverse-cosine of the sum of multiplied components between two vectors. The result should be a scalar: a single-value variable (rather than a tuple, a pair-of-values, such as vertices). Note that in our below JavaScript implementation, the result will be in radians, and not degrees, because JavaScript's Math library operators in radians.
function DotProduct(VertexA, VertexB)
{
	return Math.acos(VertexA.x * VertexB.x + VertexA.y * VertexB.y + VertexA.z * VertexB.z);
}
Now that we can compute a surface normal, and get the angle difference between that and a light-source, all we must now do is normalize the angle (which is the angle, divided by PI/2, since inverse-cosine's result ranges from 0 to PI, and PI/2 is 90 degrees, which is when the surface is perpendicular to the light source and thus no longer visible), and multiple each color channel by it. The more a surface is facing a light source, the more of its color you see; the less a surface is facing a light source, the darker it becomes.
function ComputeColor(Color, Angle)
{
	// Bounds from 0 to Pi/2
	Angle = Math.min(Angle, Math.PI / 2.0);

	// Normalize angle
	Angle /= Math.PI / 2.0;

	// Make color darker based on angle
	Color.R = Math.floor(255.0 * Angle);
	Color.G = Math.floor(255.0 * Angle);
	Color.B = Math.floor(255.0 * Angle);

	// Done!
	return Color;
}
To compute the power of visible light on a surface, we compute the angle between incoming light and the surface normal. Note that surface normals are the black vector, while the light source is the yellow vector. The greater the angle, the less light you can see, and thus the more black the surface becomes.
Finally, note that there are other properties of light not discussed here, but are important in real-world graphical applications: lights have cut-off distances, meaning that an object that is close to a light-source, will be more lit than an object that is further away. This relationship isn't linear either, but is instead close to an inverse-squared-distance function. Also notice how the light is computed for the entire surface, but not for each individual pixel: this means that though one corner is closer to the light source and thus should be more lit, we ignore this behavior because of the higher computational requirements and required pixel interpolation between vertices. Inversely to the distance problem, the closer a light source is (or the more intense it is) to a surface, the more the surface becomes luminous (i.e. color gets drowned out by bright lights).
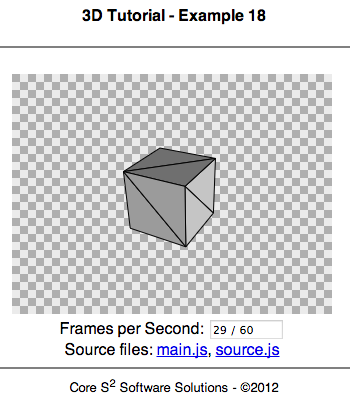
What you should see on your screen! Notice how surface colors change based on the rotation.
checkpoint
Phong Shading
Phong shading, or "smooth shading", takes the same approach from the above flat-shading, but with two differences that make the object appear much more smooth: instead of using the surfaces to calculate the light intensity, we do the same but with each vertex. By doing this with the vertices, we then interpolate the intensity between all connected points and thus the surface. This is very similar to computing the UV-coordinate based on how close or how far we are from respective vertices on the same triangle, but instead of computing the UV-value, we compute the averaged / interpolated light intensity. This requires code to be inserted in the per-pixel triangle filling.
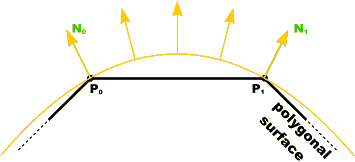
For Phong shading, we generate color by interpolating surface normals over distances from surrounding vertices, not from just one surface normals.
Note
Sometimes it is important to have both flat surfaces and smooth surfaces on the same 3D model: a classic example would be that the world's ground surface should be smooth, yet surfaces on a building should be flat. To do this, rendering systems may expect a special flag per surface-triangle from 3D models, switching between shading styles on-the-fly.
Phong Shading
Optimizations
This section is dedicated to reviewing what was written and discussing how to optimize various aspects of computer graphics as a whole, and the features we have developed in our demos. We will also cover how some of our work is done in professional graphics libraries.
Backface Culling
Backface culling is the method of removing triangles from the scene that are not visible, based on the logic that a triangle has only one visible side, and if that visible side is not facing us, we consider it hidden and thus do not render that triangle. A classic example is the cube we've been rendering across all of our lessons: for the triangles on the back of the cube, instead of removing them by drawing over them through the Painter's algorithm, we can simply choose to never render it, since it points away from the observer. Another good example would be a sphere - imagine a perfect sphere that has a volume but is not hollow. There is no need to render triangles on the other side of the sphere simply because any triangle on that side has a surface normal pointing away from the camera and are thus hidden by some other object. You might of seen backface culling unintentionally before in a video game: if you've had the game's camera bump "into" a model, you may of seen through objects, as though they had no surface. That's because you viewed them from a position where the surface normals were still pointing away from you, and thus weren't visible. The only way to see "inside" and object is if that object has the inside area modled. All of this is done to remove triangle-drawing events, thus saving computational power for the application.
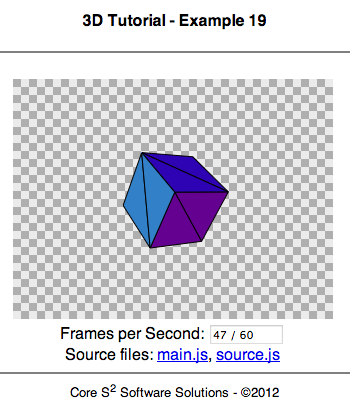
What you should see on your screen!
checkpoint
View Frustum Culling
View frustum culling has the exact same purpose as backface culling: ignore triangles that are not visible to the camera, or simply outside of the "view-volume". Since we have a line of sign, and we only see a certain degree around our eyes, there is no need to render items outside of this view-volume (such as objects on your far left, behind you, etc.), and by doing a simple inclusion check of "if this triangle is not within the view-volume, do not render", we can sometimes remove more than half of the scene's geometry! A simple example would be if you are playing a first-person shooter walking down a long hallway: it makes no sense to render the hallway behind you, since you're facing forward! View frustum culling is the logic that checks for this, and prevents unnecessary work.
One particularly interesting issue with view-frustum culling is that you can't just check for triangle-point inclusion, but you need to check for surface-segment inclusion: imagine if you use a very tall single triangle to represent a tower in the background, but the player only looks at the middle of it, then no points from this triangle would be in their view-volume! This is clearly an issue, since the tower should be rendered, thus other techniques are needed for these special cases.
Occlusion Culling
Occlusion culling is the non-trivial process of not rendering what is being occluded from view by other objects. Using the above example: if you are walking down a tunnel, there is no need to render the world's geometry that isn't visible by your camera in that tunnel, because the tunnel walls are blocking your view. Though this sounds simple enough, this is a very complex problem that requires pre-processing of scenes into special formats, since you cannot realistically solve this problem at run-time. There are also exceptions to these kind of solutions, such as what happens if a surface is a transparent texture, or a texture with holes like a cage?
One solution to this problem is called BSP, or Binary Space Partitioning. This method, made famous through the Doom game, takes a given world scene and splits it into a tree of sub-geometries where if you were to see one part of the geometry, you should view all child-geometry associated with that geometry. This is a gross simplification, but the idea is that you can quickly decide what parts of a world you can draw through a nested tree-structure. A strong knowledge of graph theory and tree data structures is required to firmly grasp this subject, and is one of the more complex problems to tackle in scene-management.
Math Optimizations
Using your language's built-in math functions is generally "good enough" for most cases. Parts of code that require heavy optimization tends to revolve around either computing square-roots (when normalizing vectors) or with trigonometric functions. Modern hardware, and compilers, are pretty smart about these kind of optimizations, and will apply appropriate changes "under-the-hood" to get your code running fast. Rarely do programmers have to program for pure performance, but in cases where you still are lacking in speed, you may want to investigate these two bottlenecks.
Fast square-roots can be accomplished either through fast approximations, or through processor-specific features / instructions. This famous "Fast inverse square root" function is seen as a monument to absolutely bizarre but effective code to tackle inverse-squares. Pre-calculating trigonometric tables is another optimization approach to take, though this approach requires hand-coding a range of new functions dealing with approximations between defined angle-values.
Finally, the most important math-related optimization that you must be aware of is the simple fact that dedicated graphics cards are computational beasts, and are very quick at doing floating-point operations in parallel. Much of what is covered here, in this article, are things that should be offloaded to your graphics-card. We do not discuss the real-world implementation of this approach (i.e. using OpenGL or DirectX libraries), but you should be aware that any sort of per-vertex computation generally should be pushed onto the graphics card. Modern processors also have a wide-array of "media registers and operators" which are special instructions to do fast floating-point work in parallel!
Conclusion
I hope this tutorial was fun and interesting, helping you better understand how 3D real-time rasterization renderers work. My personal inspiration for writing this article came from a three-part tutorial on how to create a rotating cube for my TI-83+ programmable calculator, and I have never stopped programming since. Hopefully this tutorial helps you realize your passion for programming, and that I've enabled you to continue this interest into a hobby or profession!
What should you do next? Try to write this entire project in your preferred language, or just learn a modern 3D graphics library, like OpenGL or DirectX. If you want to focus on game development, take a look at libSDL which has some great cross-platform native-language bindings. If you prefer working with managed-languages, like Java and C#, look into multi-tool platforms, such as the Unity3D game engine which comes with level, resource, and source-code editors for all major platforms.
No matter what you want to learn next, the Internet is truly your best starting point: there are a plethora of tutorials, videos, articles, and more, on any subject matter you're interested in. I strongly recommend that you look into the following sites and books, as they are great starting points for searching on the web any of the subjects the materials might introduce
- 3D Math Primer for Graphics and Game Development: This article will walk you through the entire conceptual basics of computer graphics, both in terms of technology and math. Even better: no major math knowledge is required to understand the majority of this article!
- The "Big Red Book": This is the official documentation of all OpenGL major APIs, walking you through initial setup of a workspace all the way to advanced topics.
- Introduction to 3D Game Programming with DirectX for DirectX 9, 10, or 11: Frank Luna does a great job introducing the complex DirectX APIs, and any of his books associated with
Finally, I want to thank you for reading this article. I hope that you were able to have fun while writing computer-graphics code and that you made your own little changes to have fun. All of the links scattered throughout this text were placed on purpose because I used them myself while writing, and am confident that they are great points to help you decide in what to do next. Regardless, as I say to all fellow programmers: Good luck, and have fun!